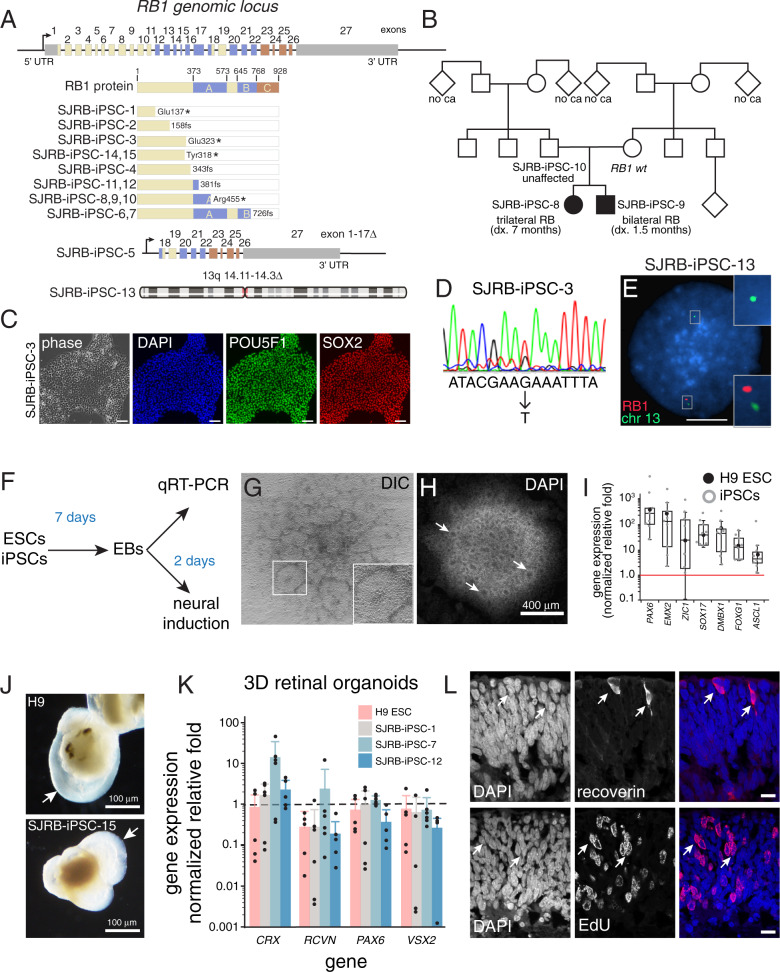
Fig. 1. Generation of iPSC lines from patients with germline RB1 mutations.
A Map of the genomic locus showing each of the 27 exons of the RB1 gene and the color-coded protein-coding domains. The germline mutations in each patient/family are shown below the full-length protein. B Representative pedigree for an unaffected carrier (SJRB-iPSC-10) and two affected children (SJ-iPSC-8 and SJ-iPSC-9). C Representative micrographs of SJRB-iPSC-3 colony immunostained for POU5F1 (green) and SOX2 (red) with DAPI (blue) nuclear stain. Staining was repeated on another iPSC line with the same results. D Sanger sequencing chromatogram showing the heterozygous nonsense mutation in the RB1 gene (GAA→UAA). E Representative two-color fluorescence in situ hybridization (FISH) of SJRB-iPSC-13 showing the 13q deletion (200 cells were analyzed). F Drawing of the neural rosette differentiation experiment. G, H Differential interference contrast (DIC) and DAPI-stained colony from the neural rosette induction procedure. Arrows and the enlarged box indicate neural rosettes. Three clones of each line were differentiated and each line was able to produce rosettes. I Boxplot of the normalized relative fold of neurogenic genes for each iPSC line (n = 15) and H9 ESCs from qRT-PCR of the neural induction assay. J Micrograph of representative retinal organoid from H9 ESCs and SJRB-iPSC-15 indicating retina (arrow). K GAPDH normalized relative fold gene expression for 3D retinal organoids from representative iPSC lines using H9 ESCs as controls. Each dot represents the mean of two technical replicates for an individual organoid. L Micrograph of cryosection of day 45 retinal organoid that was labeled with EdU for 1 h prior to harvest showing recoverin expressing photoreceptors and EdU+ retinal progenitor cells (red) with DAPI counterstain. Each of the 15 lines was sectioned showing similar results in neural retina regions. Box and whisker plots include center line as median, box as Q1 and Q3, and whiskers as 1.5× interquartile range. Scale bars: C, 50 μm; E, L, 10 μm.

