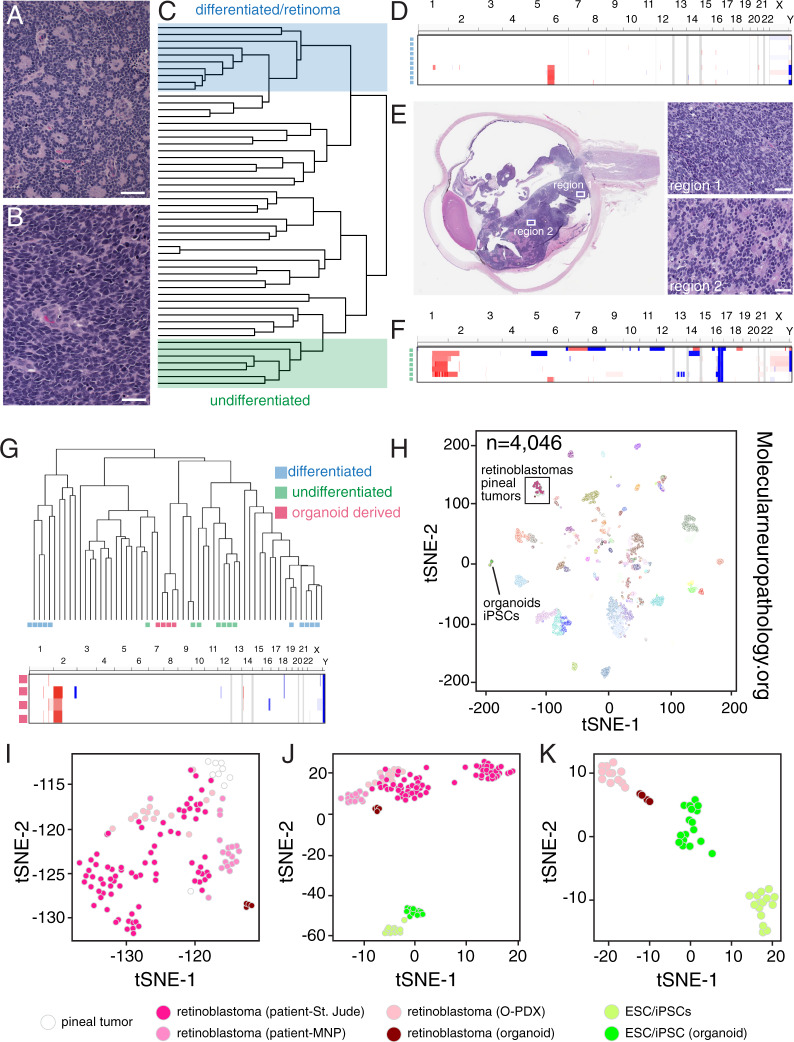
Fig. 4. DNA methylation profiling of retinoblastoma.
A, B Hematoxylin and eosin (H&E) staining of differentiated and undifferentiated patient retinoblastoma. C Unsupervised hierarchical clustering of retinoblastoma tumors showing separation of the differentiated and undifferentiated samples. D–F Copy number variation in the differentiated retinoblastomas (D) and undifferentiated patient retinoblastomas (F) and H&E staining (E) of a patient eye that has regions of both undifferentiated (region 1) and differentiated (region 2) tumor, suggesting intratumor cellular heterogeneity. G Copy number variation and clustering of the retinal organoid-derived tumors. H t-distributed stochastic neighbor embedding (tSNE) plot of the St. Jude retinoblastomas, retinal organoid-derived tumors, retinal organoids, and iPSC/ESCs integrated with the Molecular Neuropathology (MPN) database of brain regions and pediatric brain tumors. I tSNE plot of the boxed region in (H) showing clustering of the organoid-derived tumors with patient retinoblastomas. J tSNE plot of the patient, O-PDX, and organoid-derived retinoblastomas with iPSC/ESCs and normal retinal organoids. K tSNE plot of O-PDX and organoid-derived retinoblastomas with iPSC/ESCs and normal retinal organoids. Scale bars: 25 μm.

