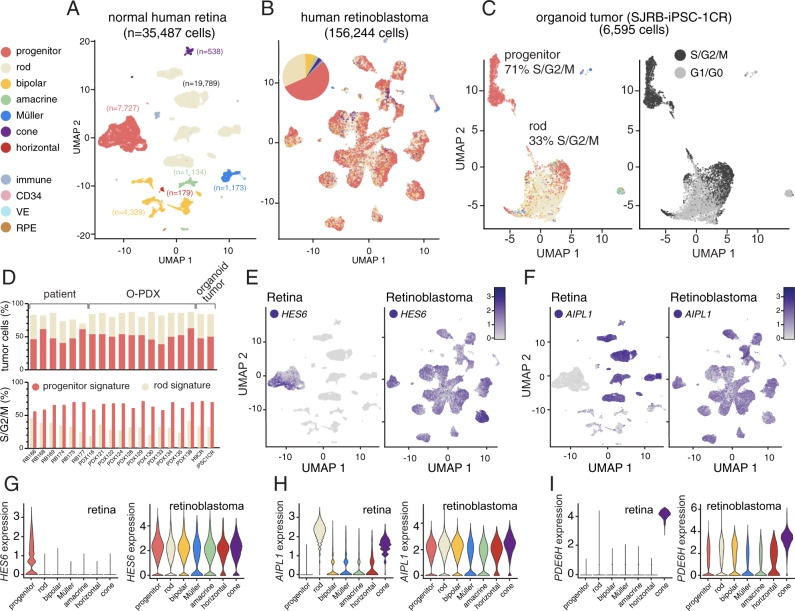
Fig. 5. Cellular heterogeneity of retinoblastomas.
A Uniform manifold approximation projection (UMAP) plot of scRNA-seq of normal human retinal cells including retinal progenitor cells and all adult retinal cell types. B UMAP plot of scRNA-seq of human retinoblastoma from patient tumors, O-PDXs, and organoid-derived tumors. The label transfer for cell identity is displayed, and the overall numbers are represented in the piechart in the upper left corner. C Representative UMAP plot of one of the organoid-derived tumors showing cells with the progenitor cell signature and rod signature and the relative distribution of gene expression profile for proliferation. D Barplot of the proportion of single cells with the retinal progenitor cell gene expression signature and the rod signature for each tumor (upper panel) and the proportion of those cells that are proliferating (S/G2/M, lower panel) for each tumor analyzed by single-cell RNA sequencing (n = 19). E, F UMAP plot of gene expression for normal retina and retinoblastoma for a representative retinal progenitor cell gene (HES6) and a photoreceptor gene (AIPL1). G, H, I Violin plot of the distribution of expression of a progenitor gene (HES6), a photoreceptor gene (AIPL1) and a cone gene (PDE6H) across retinal cell types and retinoblastomas. The colors match the colors in (A, B).

