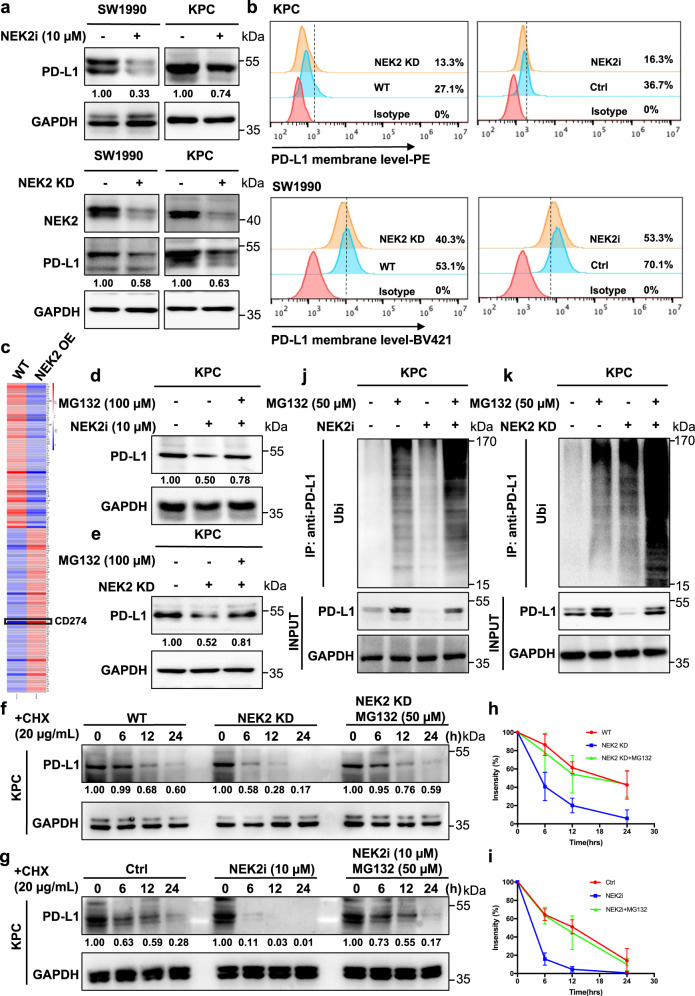
Fig. 5. NEK2 inhibits ubiquitination-mediated proteasomal degradation of PD-L1.
a, b Western blot analysis and flow cytometry of PD-L1 expression in pancreatic cancer cell lines after treatment with NEK2 inhibitor (10 μM, 24 h) and NEK2 knockdown. Representative image is shown n = 3 independent experiments. c LC–MS proteomics quantitative analysis of pancreatic cancer cells overexpressing NEK2. d Western blot analysis of PD-L1 expression in KPC cells treated with NEK2 inhibitor (10 μM, 24 h) after treatment with MG132 (100 μM, 24 h). Representative image is shown n = 3 independent experiments. e Western blot analysis of PD-L1 expression in WT and NEK2 KD KPC cells treated with MG132 (100 μM, 24 h). Representative image is shown n = 3 independent experiments. f Stability analysis of PD-L1 in KPC cells treated with NEK2 inhibitor (10 μM, 24 h) after treatment with cycloheximide (CHX) (20 μg/mL). Representative image is shown n = 3 independent experiments. g Stability analysis of PD-L1 in WT and NEK2 KD KPC cells treated with CHX (20 μg/mL). Representative image is shown n = 3 independent experiments. h, i Statistical analysis of three independent experiments is displayed. The intensity of PD-L1 protein expression was quantified using a densitometer. j Ubiquitination assay of PD-L1 in KPC cells treated with NEK2 inhibitor (10 μM, 24 h), subjected to anti-PD-L1 IP and anti-ubiquitin Western blot analysis after treatment with MG132 (50 μM, 24 h). k Ubiquitination assay of PD-L1 in WT and NEK2 KD KPC cells treated with MG132. Results represent means ± SD of one representative experiment in h and i. All data are representative of three independently performed experiments. *P < 0.05, **P < 0.01, ***P < 0.001 using a two-tailed t-test; ns: not significant.

