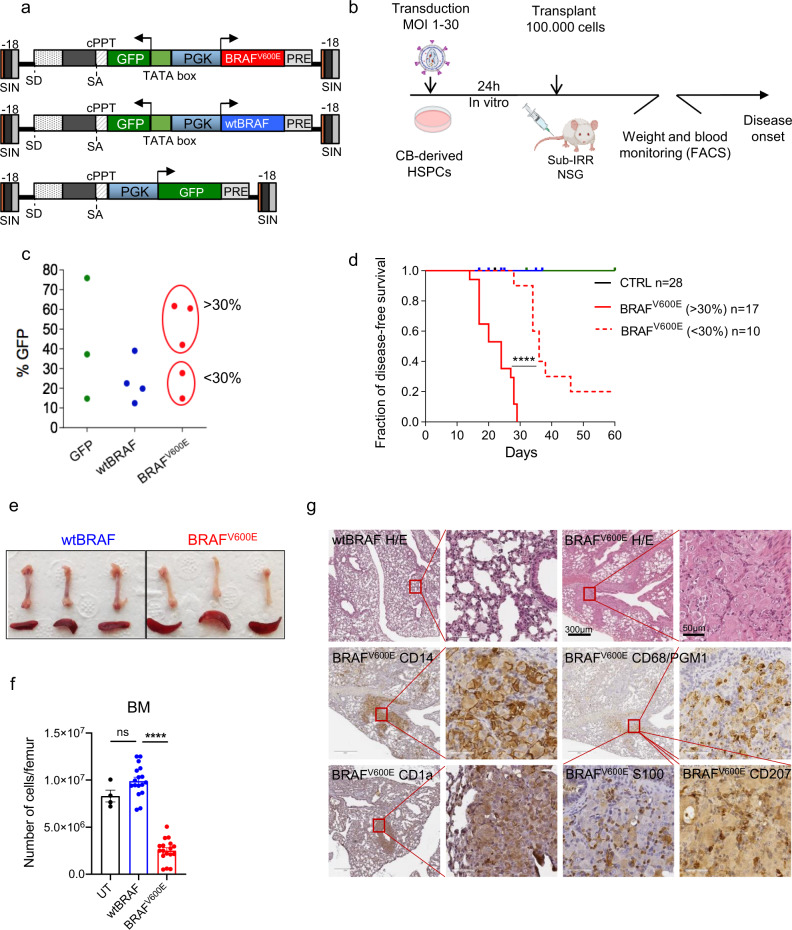
Fig. 1. BRAFV600E activation in human HSPCs leads to lethal bone marrow aplasia and histiocytosis.
Schematic representation of lentiviral vectors (a) and experimental strategy (b) employed. c In vitro transduction level of GFP (green), wtBRAF (blue), and BRAFV600E-expressing HSPCs (red). d Disease-free survival curves from CTRL group (mice receiving untransduced HSPCs (black, n = 3)), GFP only (green, n = 12), wtBRAF-expressing HSPCs (blue, n = 13), and mice transplanted with BRAFV600E-expressing HSPCs (red) at different transduction levels (<30%, dashed line, n = 10 and >30%, continuous line, n = 17). Statistical test: log-rank (Mantel−Cox) test between survival curves of the low (<30% BRAFV600E-expressing HSPCs) and high (>30% BRAFV600E-expressing HSPCs) dose BRAFV600E groups. ****p < 0.0001. e Representative images of femur and spleen from mice transplanted with wtBRAF and BRAFV600E-expressing HSPCs at the time of sacrifice. f Number of cells in femurs of mice transplanted with untransduced (UT, black, n = 4), wtBRAF (blue, n = 17) or BRAFV600E (red, n = 17)-expressing HSPCs. Data presented as mean values +/− SEM. Statistical test: Kruskal−Wallis with Dunn’s multiple comparisons ****p = 0.0001; ns non significant. g Immunohistochemical analysis of a lung lesion from a representative mouse transplanted with BRAFV600E-expressing HSPCs at the time of sacrifice. Lung morphology analyzed by hematoxylin and eosin staining. A lung of a mouse transplanted with wtBRAF-expressing HSPCs was used as control. Markers for immunohistochemistry include: CD14 for monocytes, CD1a for myeloid dendritic cells, CD68/PGM1 for large macrophages, S100 for dendritic cells, and CD207 for smaller dendritic cells. Scale bars: 50 or 300 µm. (n = 4 mice for wtBRAF and n = 3 mice for BRAFV600E group).

