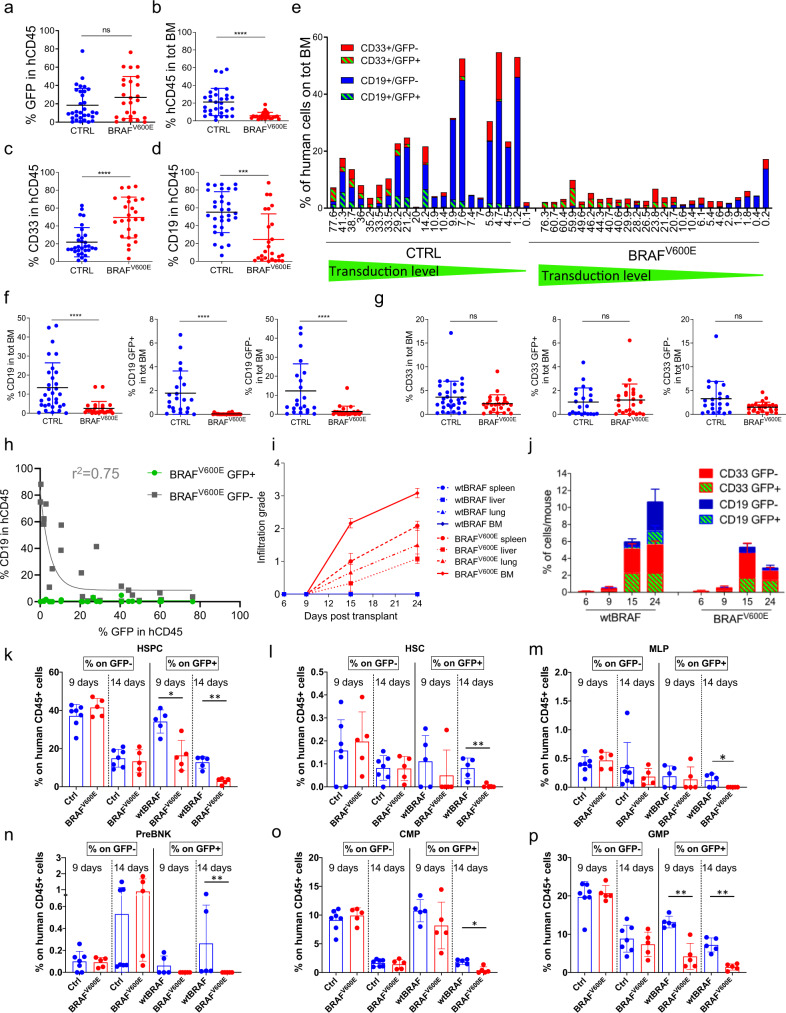
Fig. 2. BRAFV600E expression in human HSPCs results in a dose-dependent lymphoid impairment.
Percentage of (a) GFP+ cells within the human graft (hCD45+), (b) human engrafted cells in total BM and (c) myeloid (CD33+) and (d) lymphoid B cells (CD19+) within the human graft at euthanasia, in the BM of mice transplanted with CTRL (wtBRAF or GFP only, blue, n = 31) and BRAFV600E (red, n = 25) cells. Data are presented as mean +/− SD. Statistical test: Two-tailed Mann−Whitney. e Percentage of myeloid GFP+ (red, dashed green) and myeloid GFP− (red), B (CD19+) cells GFP− (blue) and B cells GFP+ (blue, dashed green) within total BM from mice transplanted with CTRL or BRAFV600E HSPCs. Values on x-axis were ordered by transduction level. Percentage of GFP+ and GFP− (f) B cells or (g) myeloid cells within total BM from mice transplanted with CTRL (blue, n = 31 for left panel, n = 22 for mid and right panel) and BRAFV600E-expressing (red, n = 25) HSPCs. Data are represented as mean values +/− SD. Statistical test: two-tailed Mann−Whitney. h Percentage of GFP+ and GFP− CD19+ cells with respect to CD45+/GFP+ in each mouse. Exponential regression analysis. The goodness of fit measured as R2. i Time-course of infiltration grade in organs from mice of the wtBRAF (blue) and BRAFV600E (red) groups; n = 3 for each time point. Data are presented as mean +/− SD. Spleen: dashed line, circles; liver: dashed line, squares; lung: dashed line, triangles; BM: continuous line, dots. j Time-course analyses of the percentage of GFP+ and GFP− myeloid and B cells in BM of mice transplanted with wtBRAF or BRAFV600E HSPCs; n = 3 each time point. Data are presented as mean +/− SD, see (e) for color code. k–p Percentage of human HSPCs subpopulations within GFP− and GFP+ cells in BM cells harvested from mice at 9 and 14 days after transplant with CTRL (untransduced, blue, n = 2 for each time point), wtBRAF (blue, n = 5 for each time point) and BRAFV600E (red, n = 5 for each time point) HSPCs. Data are presented as mean +/− SD (HSPC hematopoietic stem and progenitor cells; HSC hematopoietic stem cells; MLP multi-lymphoid progenitors; PreBNK B and NK cell progenitors; CMP common-myeloid progenitors; GMP granulocyte/monocyte progenitors). Statistical analysis between groups by two-tailed Mann−Whitney test. ns non-significant; *p < 0.05; **p < 0.01; ***p < 0.001; ****p < 0.0001.

