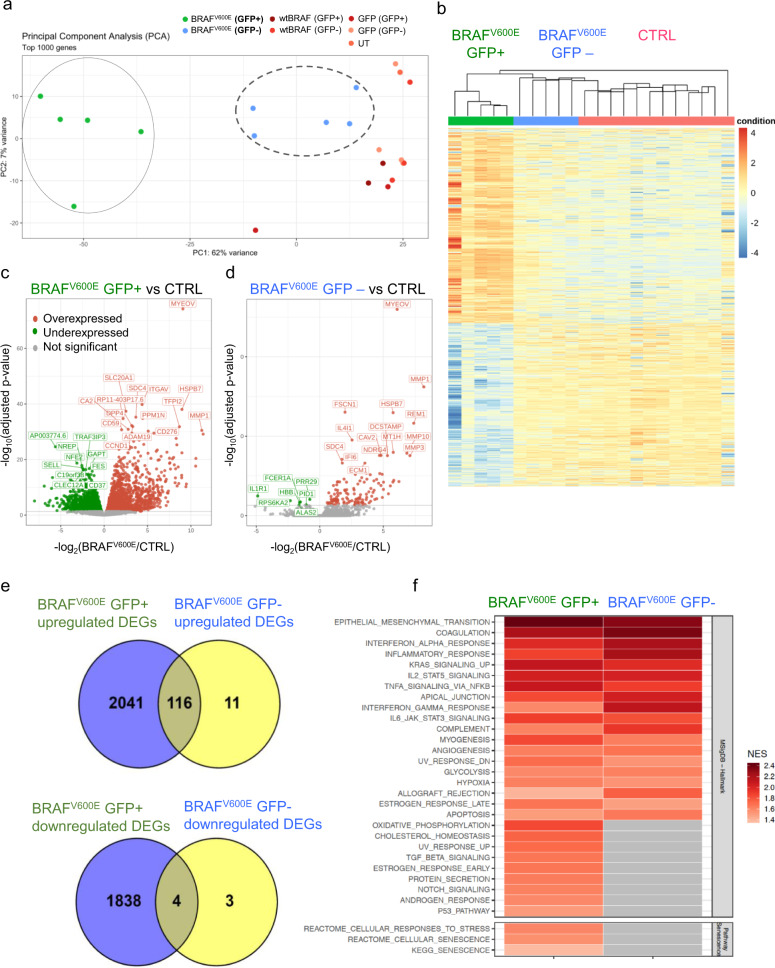
Fig. 3. Global gene expression analysis upon oncogene-activation.
a Principal component analysis (PCA) of transcriptional profiles of sorted human myeloid cells (CD33+) GFP+ and GFP− fractions from control mice, transplanted with human HSPCs transduced with GFP (light pink for GFP− and dark pink for GFP+), wtBRAF (light red for GFP− and dark red for GFP+) or untransduced cells (salmon), and mice transplanted with BRAFV600E-expressing HSPCs at 16 days post-transplantation (green for GFP+ and blu for GFP− cells). b Unsupervised clustering analysis of DEGs in the different experimental groups. c, d Volcano plots highlighting significant downregulated (green) and upregulated (red) genes in sorted human myeloid cells (CD33+) from the BRAFV600E mice group (both GFP+/− fractions) compared to controls. The gene symbols of the top 15 upregulated and the top ten downregulated genes based on adjusted p-value are indicated. Statistical test: two-sided exact test for negative-binomial distribution, the Benjamini and Hochberg’s approach has been used for controlling the false discovery rate (FDR). e Venn Diagram representation of upregulated and downregulated DEGs in GFP+ and GFP− CD33+ cells of the BRAFV600E group showing that about 90% of the DEGs in the GFP− fraction were also deregulated in the GFP+ fraction. f Gene set enrichment analysis (GSEA) of sorted CD33+/GFP+ and CD33+/GFP− cells from the BRAFV600E group. Normalized enrichment score (NES) is indicated.

