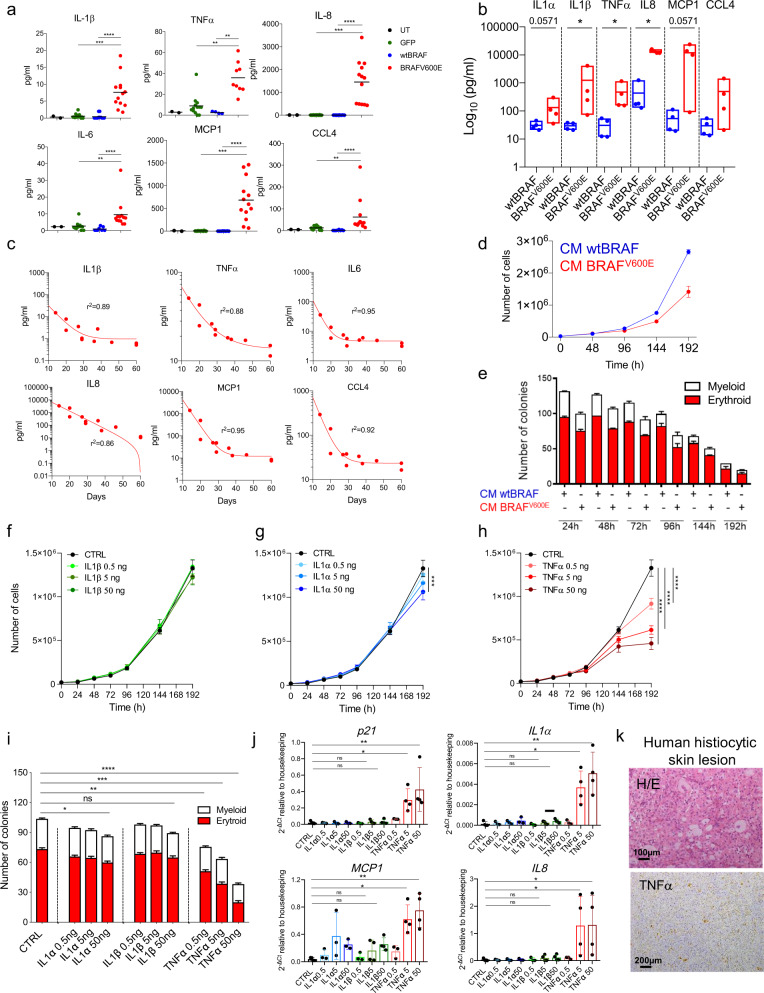
Fig. 7. SASP factors from senescent HSPCs induce paracrine senescence in non-oncogene-expressing cells.
Concentrations of human pro-inflammatory factors in (a) blood serum of mice at euthanasia or (b) in cultured media 120 h post-transduction. For (a), each dot represents a mouse: untreated (UT, black, n = 2), GFP (green, n = 13), wtBRAF (blue, n = 4), BRAFV600E (red, n = 13). For (b), wtBRAF (blue), and BRAFV600E (red), four donors for each group. Data are presented as box plots minimum to maximum with lines representing means. c Correlation between blood cytokine levels and survival of BRAFV600E mice (n = 11). Non-linear regression one-phase decay. The goodness of fit: R2. d Growth curve of HSPCs exposed to CM from wtBRAF or BRAFV600E HSPCs. n = 9 for three donors/group. Data are presented as mean values +/− SD. e Clonogenic potential of HSPCs exposed to CM from wtBRAF or BRAFV600E HSPCs. n = 7 for three donors/group. Data are presented as mean values +/− SEM. f–h Growth curves of HSPCs exposed to cytokines: (f) IL1α (light green: 0.5 ng/ml, medium green: 5 ng/ml and dark green: 50 ng/ml), (g) IL1β (light blue: 0.5 ng/ml, medium blue: 5 ng/ml and dark blue: 50 ng/ml) and (h) TNFα (light red: 0.5 ng/ml, medium red: 5 ng/ml and dark red: 50 ng/ml). Technical replicates: CTRL (n = 5), IL1α-IL1β-TNFα (n = 4). CTRL values (black) are repeated in f, g, and h. Data are presented as mean values +/− SD. Statistical test: linear mixed-effects model (LME), followed by post hoc analysis at 24 and 192 h. See also Source Data file. i Clonogenic potential of HSPCs treated with recombinant cytokines for 96 h. CTRL(n = 4), IL1α (n = 4), IL1β (n = 4), TNFα (n = 4). Data are presented as mean values +/− SEM. j Gene expression analysis of p21, IL1α, MCP1, and IL8 upon cytokine treatments (three donors for: CTRL, IL1α0.5, IL1α5, IL1α50, IL1β0.5, and TNFα0.5; four donors for: IL1β5, IL1β50, TNFα5, and TNFα50). Data are presented as mean +/− SD. k Representative images of a skin lesion from an histiocytosis patient stained for TNFα. Tissue morphology analyzed by hematoxylin and eosin (H/E). Scale bars: 100 or 200 µm. Statistical tests: for (b), two-tailed Mann−Whitney; for a, i, j, Kruskal−Wallis with post-Dunn’s multiple comparisons. ns non significant; *p < 0.05; **p < 0.01; ***p < 0.001; ****p < 0.0001.

