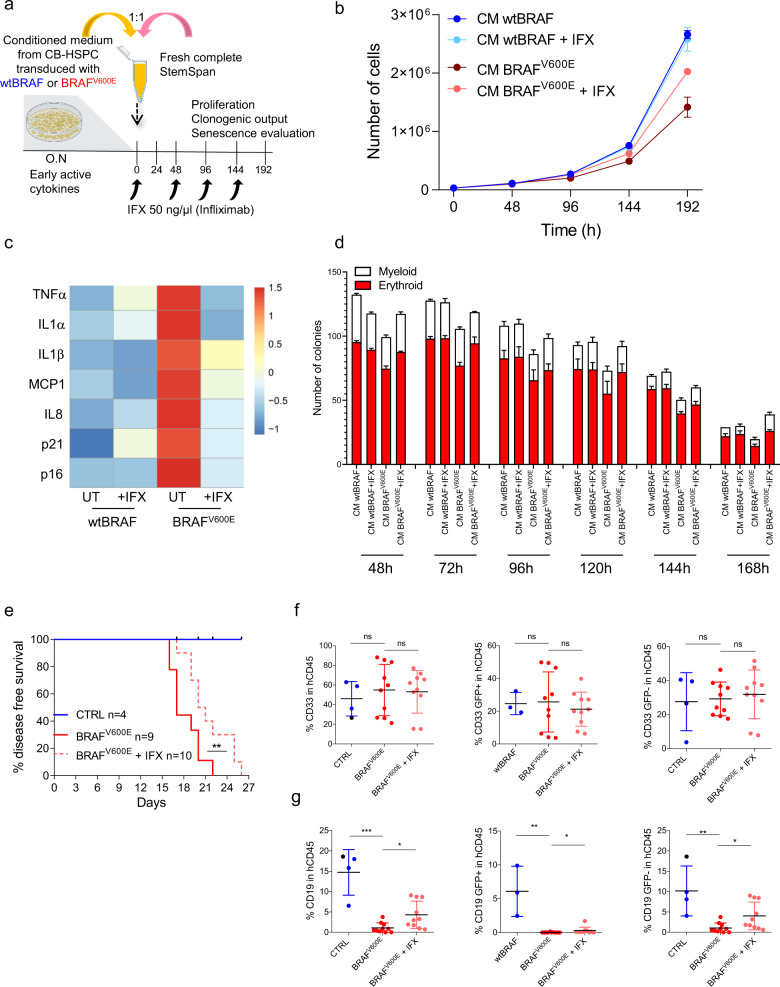
Fig. 8. TNFα inhibition rescues paracrine HSPC dysfunction upon oncogene activation.
a Schematic representation of cell treatments with conditioned medium derived from HSPCs transduced with wtBRAF or BRAFV600E lentiviral vectors, treated or not with a TNFα inhibitor (Infliximab; IFX) at the indicated concentration and time points. b Growth curve of HSPCs cultured with CM derived from HSPCs transduced with wtBRAF (dark blue) and BRAFV600E (dark red) treated or not with IFX (light blue for wtBRAF and light red for BRAFV600E). n = 9 measurements for three donors in all groups. Untreated samples are same as in Fig. 7d. Data are presented as mean values +/− SD. c Heatmap representation of gene expression analysis of senescence-associated markers in CM-treated HSPCs. Untreated n = 4, treated n = 3 biological replicates. d Clonogenic potential of HSPCs cultured with CM from transduced HSPC treated with IFX for 48-72-168-192 h: three measurements for n = 1 in all groups; 72−96 h: nine measurements for n = 3 independent donors in all groups. Untreated samples are same as in Fig. 7e. Data are presented as mean values +/− SD. e Disease-free survival analysis of mice transplanted with BRAFV600E HSPCs upon treatment with IFX (CTRL = 4 mice, blue; BRAFV600E = 9 mice, red continuous line; BRAFV600E + IFX = 10 mice, red dashed line). Log-rank test between IFX treated and untreated mice from the BRAFV600E group. **p < 0.01. Immunophenotypical analysis of (f) myeloid output (CD33+) or (g) lymphoid output (CD19+) with GFP+ and GFP− lineage for each experimental group. (CTRL = 4 mice, blue for wtBRAF and black for UT; BRAFV600E = 9 mice, red; BRAFV600E + IFX = 10 mice, light red). Data are presented as mean values +/− SD. Statistical test: Kruskal−Wallis with Dunn’s multiple comparisons comparing to BRAFV600E group. *p < 0.05;**p < 0.01; ***p < 0.001; ns non-significant.

