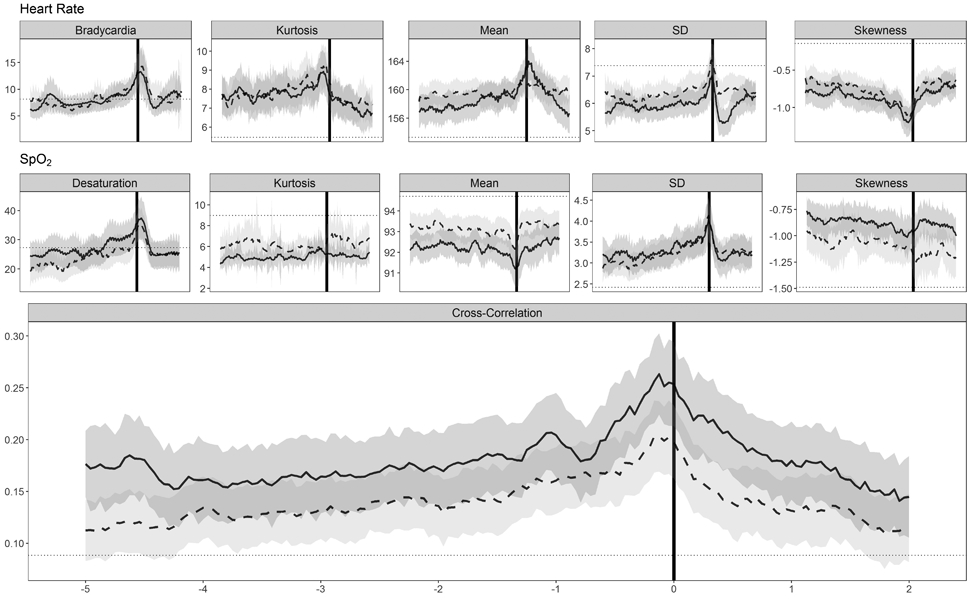
Fig. 2.

HR and SpO2 features plotted as the 12hr moving average from five days before to two days after the time of blood culture, grouped by diagnosis (LOS, solid line; SRO, dashed line). Gray shaded areas represent the 95% confidence intervals and a horizontal dotted line is drawn on each panel at the mean for all UVA VLBW infants at all available times for that feature.
