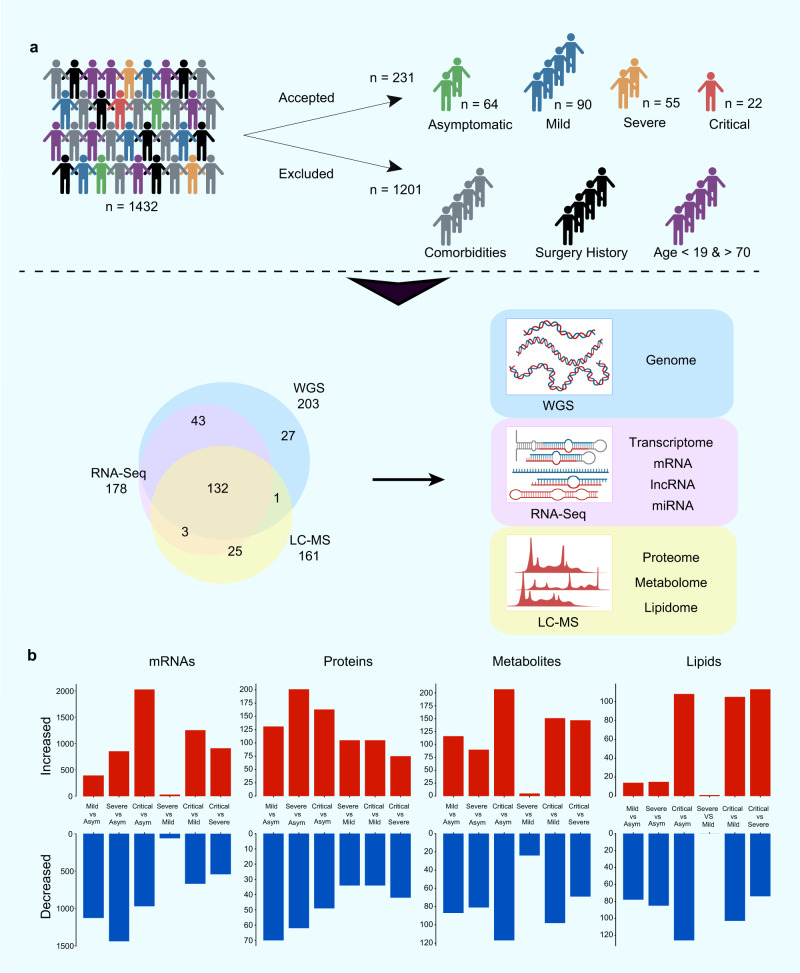
Fig. 1. Patient enrollment, study design, and trans-omics profiling of COVID-19.
a Overview of COVID-19 patient enrollment criteria and study design, including multi-omics profiling of blood samples from COVID-19 patients spanning four disease severities (asymptomatic (asym), mild, severe, and critical). Venn diagram showing overlapping samples profiled using WGS, RNA-seq, and LC-MS. b Bar plot showing the numbers of significantly differentially expressed mRNAs, proteins, metabolites, and lipids in six groups of comparison. The mRNA analysis included asymptomatic (n = 64), mild (n = 64), severe (n = 34), and critical (n = 16) COVID-19 patients. P values for mRNAs were calculated using Wald test (two-sided). The proteins, metabolites, and lipids analysis included asymptomatic (n = 53), mild (n = 54), severe (n = 33), and critical (n = 21) COVID-19 patients. P values for proteins, lipids and metabolites were calculated using Mann–Whitney U test (two-sided). Multiple comparisons adjustment was performed using Benjamini-Hochberg (BH) method. Exact P value and source data were included in the Source Data file.

