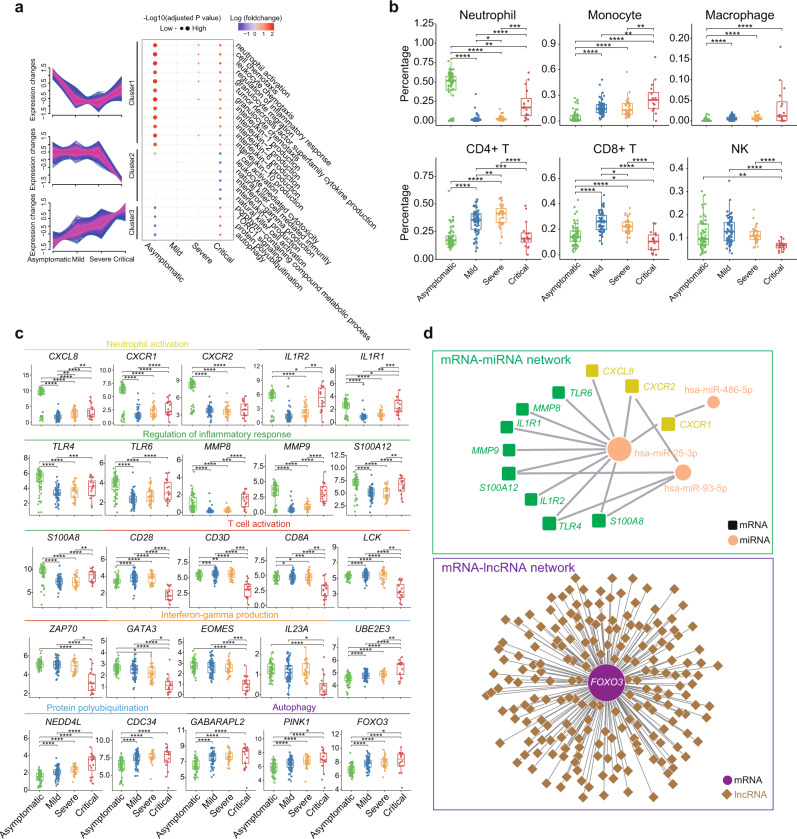
Fig. 2. Transcriptomic hallmarks of COVID-19.
a Clustering of differentially expressed mRNAs and bubble plot showing GO terms enriched in each cluster across four disease severity groups. Red and blue represent up-regulation or down-regulation of genes in corresponding GO term in an investigated group compared to mild group (median of log2 (fold-changes)). Dot size represents -log10 (adjusted P values). P values were calculated using hypergeometric test (two-sided). b Estimated immune cell abundance using CIBERSORTx for asymptomatic (n = 64), mild (n = 64), severe (n = 34), and critical (n = 16) COVID-19 patients. P values were calculated using Wilcoxon signed-rank test (two-sided). c Boxplot of representative genes associated with neutrophil activation, regulation of inflammatory response, T cell activation, interferon-gamma production, protein polyubiquitination, and autophagy in asymptomatic (n = 64), mild (n = 64), severe (n = 34), and critical (n = 16) COVID-19 patients. We performed comparisons between arbitrary two groups. P values were calculated using the Wald test and significant P values were shown in boxplot. d mRNA-miRNA and mRNA-lncRNA interaction networks for genes mentioned in Fig. 2c. The bold lines, upper boundaries and lower boundaries of notches represent the medians, 75th percentiles and 25th percentiles, respectively. Whiskers extend 1.5 times interquartile range (IQR). * means adjusted P value ≤ 0.05, ** means adjusted P value ≤ 0.01, *** means adjusted P value ≤ 0.001 and **** means P ≤ 0.0001, if not indicated, means adjusted P value > 0.05. Multiple comparisons adjustment was performed using Benjamini-Hochberg (BH) method. Exact P value and source data were included in the Source Data file.

