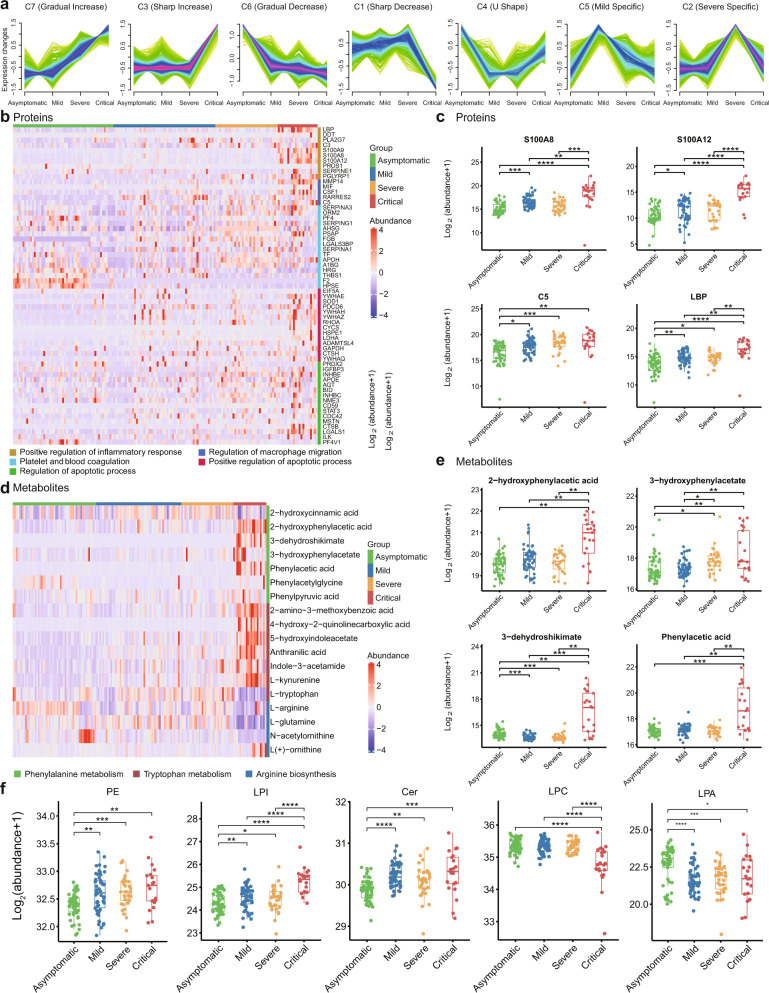
Fig. 3. Landscape of proteins, metabolites, and lipids in COVID-19.
a Expression patterns of COVID-19 plasma analytes, including proteins, metabolites, and lipids, across four disease severity groups. b Heatmap representing protein expression in five functional categories in asymptomatic (n = 53), mild (n = 54), severe (n = 33), and critical (n = 21) COVID-19 patients. Each column indicates a COVID-19 patient sample, and each row represents a protein. Colors of each cell show Z-score of log2 protein abundance in that sample. c Boxplots of representative proteins. We performed comparisons between the arbitrary two groups. The proteins analysis included asymptomatic (n = 53), mild (n = 54), severe (n = 33), and critical (n = 21) COVID-19 patients. P values were calculated using Wilcoxon signed-rank test (two-sided) and significant P values were shown in boxplot. d Heatmap representing metabolite expression in phenylalanine, tryptophan metabolism, and arginine biosynthesis pathways in asymptomatic (n = 53), mild (n = 54), severe (n = 33), and critical (n = 21) COVID-19 patients. Colors of each cell show Z-score of log2 metabolites abundance in that sample. e Boxplots of representative metabolites. We performed comparisons between arbitrary two groups. The metabolites analysis included asymptomatic (n = 53), mild (n = 54), severe (n = 33), and critical (n = 21) COVID-19 patients. P values were calculated using Wilcoxon signed-rank test (two-sided) and significant P values were shown in boxplot. f Representative lipid expression changes across four disease severity groups. The lipids analysis included asymptomatic (n = 53), mild (n = 54), severe (n = 33), and critical (n = 21) COVID-19 patients. P values were calculated using Wilcoxon signed-rank test (two-sided) and significant P values were shown in boxplot. The bold lines, upper boundaries and lower boundaries of notches represent the medians, 75th percentiles and 25th percentiles, respectively. Whiskers extend 1.5 times interquartile range (IQR). * means adjusted P value ≤ 0.05, ** means adjusted P value ≤ 0.01, *** means adjusted P value ≤ 0.001 and **** means P ≤ 0.0001, if not indicated, means adjusted P value > 0.05. Multiple comparisons adjustment was performed using Benjamini-Hochberg (BH) method. Exact P value and source data were included in the Source Data file.

