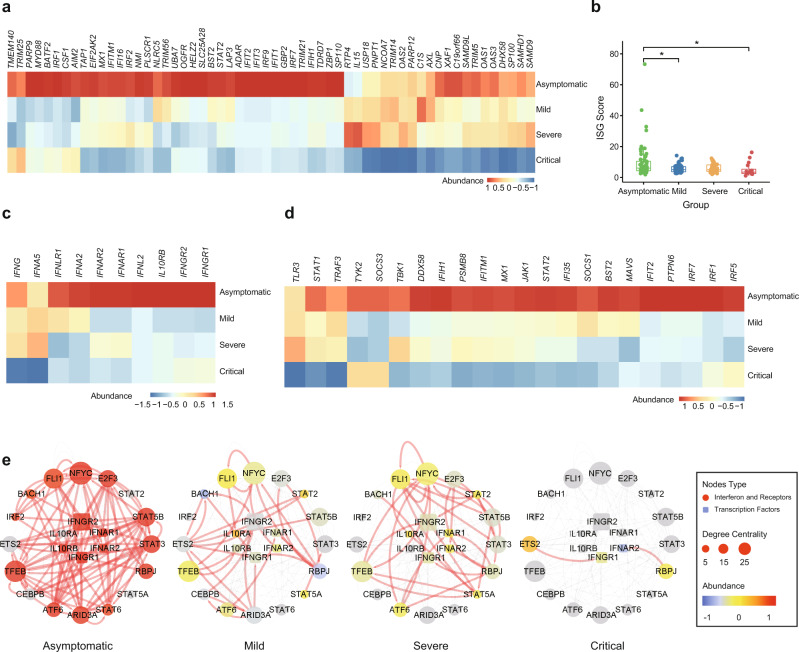
Fig. 6. Impaired interferon (IFN) response in critically ill COVID-19 patients.
a Heatmap demonstrating expression levels of IFN-stimulated genes (ISG) in asymptomatic (n = 64), mild (n = 64), severe (n = 34), and critical (n = 16) COVID-19 patients. b Quantification of ISG scores (measured by the mean expression of genes mentioned in Fig. 6a) in asymptomatic (n = 64), mild (n = 64), severe (n = 34), and critical (n = 16) COVID-19 patients. We performed comparisons between arbitrary two groups. P values were calculated using Wald test (two-sided) and significant P values were shown in boxplot. The bold lines, upper boundaries and lower boundaries of notches represent the medians, 75th percentiles and 25th percentiles, respectively. Whiskers extend 1.5 times interquartile range (IQR). * means adjusted P value ≤ 0.05, ** means adjusted P value ≤ 0.01, *** means adjusted P value ≤ 0.001 and **** means P ≤ 0.0001, if not indicated, means adjusted P value > 0.05. Multiple comparisons adjustment was performed using Benjamini-Hochberg (BH) method. Exact P value and source data were included in the Source Data file. c Heatmap of mRNA of IFN and IFN receptors in asymptomatic (n = 64), mild (n = 64), severe (n = 34), and critical (n = 16) COVID-19 patients. d Heatmap of mRNA of upstream regulators of IFN signaling in asymptomatic (n = 64), mild (n = 64), severe (n = 34), and critical (n = 16) COVID-19 patients. e Gene regulatory sub-network of IFN and IFN receptors. Nodes were colored based on mRNA expression abundance, which was scaled in different groups, and size of nodes corresponds to degree centrality. Color and size of edges represent whether a regulation relationship for each pair exists in different groups.

