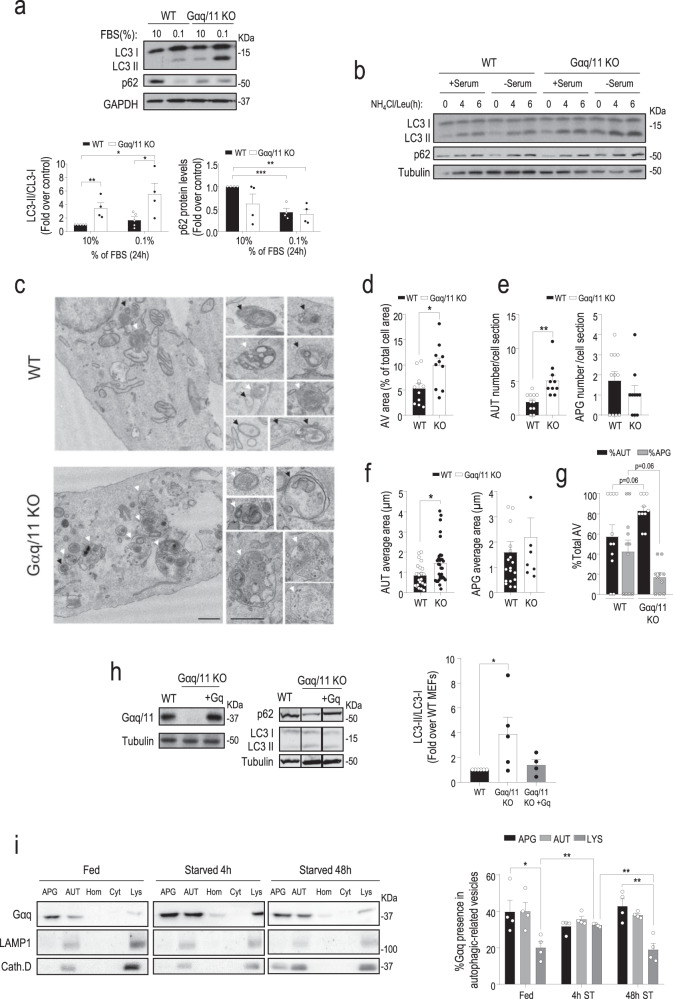
Fig. 1. Gαq/11 is a potential modulator of autophagy.
a WT (n = 5) and Gαq/11 KO (n = 4) MEFs were cultured for 24 h with 10% or 0.1% FBS and analyzed by immunoblot for LC3-I/II or p62 (WT n = 4, Gαq/11 KO n = 4) autophagic markers. Both markers were normalized with GAPDH. Data are mean ± SEM of the indicated independent experiments. LC3-II/LC3-I graph: WT (10%) vs. Gαq/11 KO (10%), P value = 0.0091; WT (0.1%) vs. Gαq/11 KO (0.1%), P value = 0.0389; WT (10%) vs. Gαq/11 KO (0.1%), P value = 0.0151. p62 graph: WT (10%) vs. WT (0.1%), P value = 0.0004; WT (10%) vs. Gαq/11 KO (0.1%), P value = 0.0012. b WT and Gαq/11 KO MEFs starved with serum-free DMEM for 16 h were treated with a combination of NH4Cl (20 mM) and leupeptin (100 µM) (NH4Cl/Leu) during the last 4–6 h of the starvation period and autophagic markers assessed as above. A blot representative of three independent experiments is shown. c Representative transmission electron microscopy images of WT and Gαq/11 KO MEFs maintained at 10% FBS. Insets on the right show examples of autophagosomes and autolysosomes in WT and Gαq/11 KO MEFs. Scale bar, 0.5 µm. Black arrows indicate autophagosomes and white arrows autolysosomes. Representative images of three independent experiments are shown. d–g Morphometric analysis of micrographs as the ones shown in panel c to calculate the fraction of the cell occupied by autophagic vacuoles (AV) of WT (n = 11) or Gαq/11 KO (n = 10) MEFs, P value = 0.0133 (d), number of autolysosomes (AUT) and autophagosomes (APG) of WT (n = 11) or Gαq/11 KO (n = 10) MEFs, P value (AUT) = 0.0011 and P value (APG) = 0.3040 (e), the average area of autolysosomes (AUT), WT(n = 22) and Gαq/11 KO (n = 32) MEFs, P value = 0.0146; and autophagosomes (APG), WT (n = 19) and Gαq/11 KO (n = 8) MEFs, P value = 0.4615 (f), the fraction of total AV contributed by AT and APG, WT (n = 11) or Gαq/11 KO (n = 10) MEFs, P values shown in the figure (g). Values are mean ± SEM of the indicated structures observed in >12 micrographs from three independent experiments. h Comparative analysis of autophagic markers (representative blot and graph) and Gαq/11 (representative blot) in WT (n = 6) or Gαq/11 KO (n = 5) MEFs and in cells re-expressing Gαq in the deficient background (Gαq/11 KO + Gq, n = 4) maintained in the presence of serum. Data are mean ± SEM of four independent experiments, P value = 0.0429. i Immunoblot analysis of Gαq and of the lysosomal/autolysosomal markers LAMP1 and Cathepsin D in autophagy-related organelles isolated from livers of fed or 4 and 48 h starved (ST) rats. Homogenate (Hom); cytosol (Cyt); autophagosomes (APG); autolysosomes (AUT); lysosomes (Lys). A representative blot is shown. Densitometry quantification values are expressed as the percentage of total Gαq protein associated to each autophagic/lysosomal compartment. Values are the mean ± SEM of four experiments. APG (Fed) vs. LYS (Fed), P value = 0.0316; LYS (Fed) vs. LYS (4 h ST), P value = 0.0091; LYS (4 h ST) vs. LYS (48 h ST), P value = 0.0081; APG (48 h ST) vs. LYS (48 h ST), P value = 0.0038. Statistical significance was analyzed using two-sided unpaired t-test. For all P values, *P < 0.05, **P < 0.005, ***P < 0.001. Source data are provided as a Source Data file.

