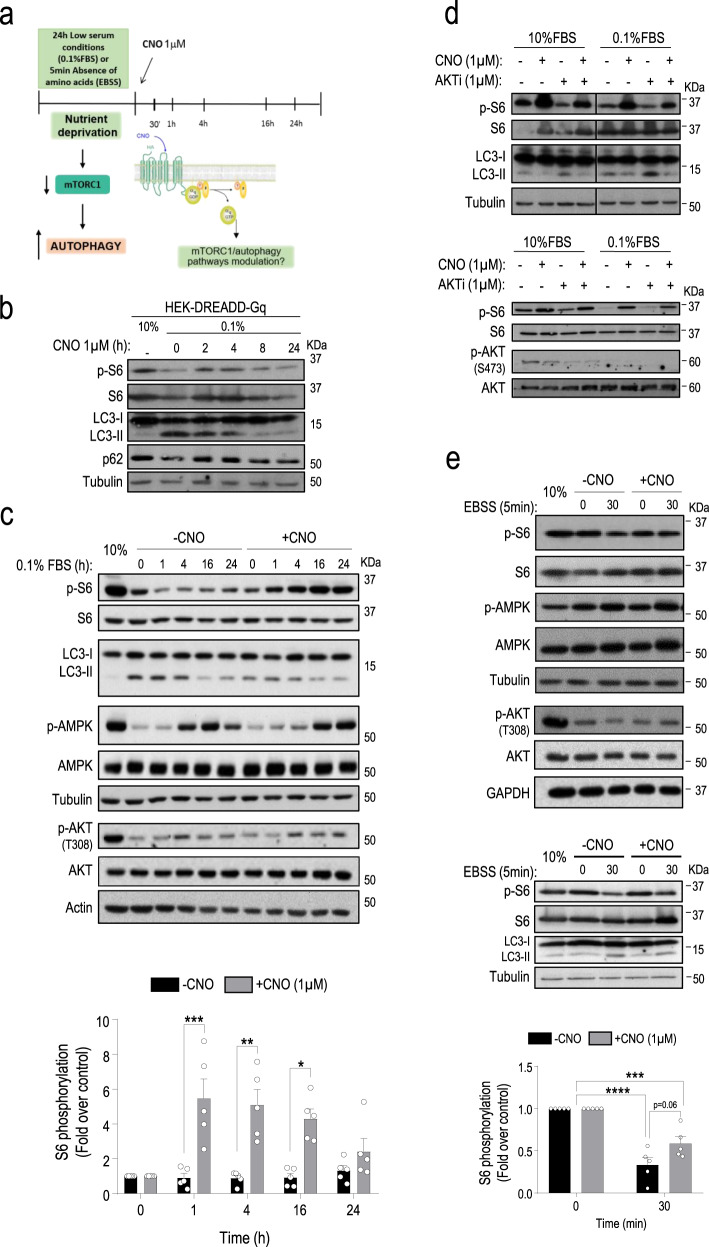
Fig. 3. The specific activation of Gαq/11 leads to the activation of mTORC1 and reverts the autophagic phenotype promoted by nutrient stress conditions.
a Experiment outline diagram. DREADD-Gq-HEK-293 cells growing in 10% FBS were starved with 0.1% FBS medium (24 h) or EBSS (5 min) and subsequently stimulated with vehicle or Clozapine-N-Oxide (CNO) (1 µM) for 1, 4, 16 or 24 h (serum context) or 30 min (amino acid context). b Cells growing in 10% FBS were starved for 16 h with serum-free medium and then stimulated or not with CNO (1 µM) for the indicated times. c Cells growing in 10% FBS were starved for 24 h with 0.1% FBS medium and stimulated with CNO or vehicle for different times. −CNO(1 h) vs. + CNO(1 h), P value = 0.0043; −CNO(4 h) vs. + CNO(4 h), P value = 0.0015; −CNO(16 h) vs. + CNO(16 h), P value = 0.0005. d Cells growing in 10% FBS or starved for 24 h with 0.1% FBS medium were stimulated with CNO (1 µM) or vehicle for 4 h in the absence or presence of the AKTi-1/2 inhibitor (1 µM). e Cells growing in 10% FBS were starved for 5 min with EBSS and stimulated or not with CNO for 30 min. ±CNO(0 min) vs. –CNO(30 min), P value <0.0001; ±CNO(0 min) vs. +CNO(30 min), P value = 0.008. In the different panels, autophagic markers (LC3-I/II, p62) were analyzed by western blot and the activation of mTORC1, Akt and AMPK pathways by assessing their phosphorylation status or that of downstream targets of mTORC1 (S6 ribosomal protein). Tubulin, actin, or GAPDH were used as loading controls. Blots are representative of three (panels b, d, and panel e lower blots) or five (panels c and e) independent experiments. Phospho-S6 data (mean ± SEM of five independent experiments) were normalized using total S6 ribosomal protein. See Supplementary Fig. 7b–d for additional readouts and graphs related to these experiments. Statistical significance was analyzed using two-sided unpaired t-test. For all P values, *P < 0.05, **P < 0.005, ***P < 0.001, ****P < 0.0001. Source data are provided as a Source Data file.

