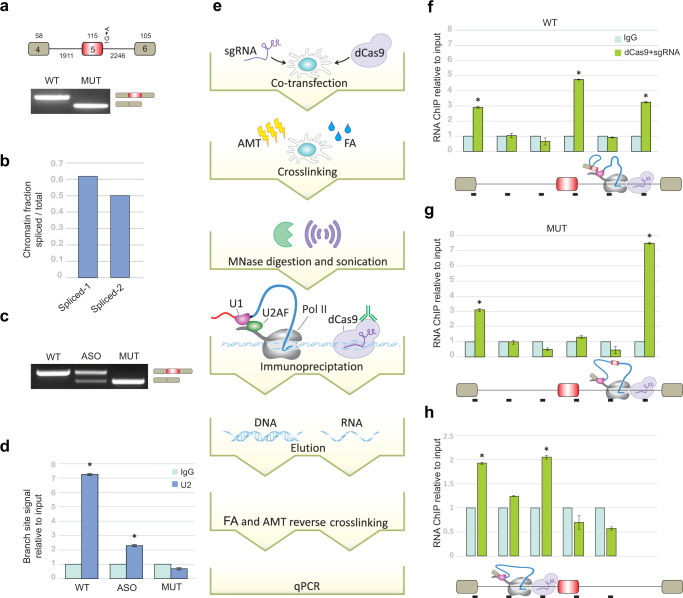
Fig. 1. The 5′SS regions of pre-mRNAs are associated with pol II located in the middle of the downstream intron.
a Upper panel: Diagram of FRG1 minigene. 5′SS + 1 position mutation from G to A. Exon numbers and the exon and intron lengths are indicated. Lower panel: RT-PCR analysis of FRG1 WT and MUT cells. Source data are provided as a Source Data file. b Amount of chromatin-associated RNA determined by qRT-PCR with exon–exon junction quantity divided by the sum of exon–exon and exon–intron junctions quantity29. One experiment was done. Spliced-1 denotes the exon 1–exon 2 junction and Spliced-2 denotes the exon 2–exon 3 junction. c Cells that express WT FRG1 were treated with or without 750 nM of antisense oligonucleotide (ASO) complementary to the 5′SS region of intron 2 of the FRG1 minigene. After 48 h, RNA was extracted, and the splicing pattern was examined by RT-PCR for ASO-treated cells, for WT and MUT cell lines. d RNA-ChIP analysis with anti-U2 snRNP antibody and IgG antibody as negative control were performed in WT, WT ASO-treated, and MUT cells. qRT-PCR was performed to quantify the amount of branch-site region from the first intron that was precipitated. N = 3 independent experiments. Error bars show mean values ± SD. Asterisk indicates for WT P = 0.006 and for ASO P = 0.005, two-tailed t-test. e Schematic overview of our CRISPR interference-based protocol. Cells are co-transfected with plasmids for expression of HA–dCas9 and sgRNA complementary to the desired location in a gene. After 48 h, cells are treated with FA and AMT, and nuclei are purified. Chromatin is digested with MNase and sonicated. Immunoprecipitation is performed with an anti-HA antibody, followed by RNA or DNA extraction, and real-time PCR analyses. f–h CRISPR interference-based experiments were performed with anti-HA antibody and IgG antibody as a negative control to evaluate the association of various transcript regions with pol II located f mid-intron 2 of WT FRG1, g mid-intron 2 of MUT FRG1, and h mid-intron 1 of WT FRG1. Mean RNA levels were measured. N = 3 independent experiments. Each bar corresponds to the amplified segment marked in the gene diagram below the graph. Error bars show mean values ± SEM. Asterisk indicates from left to right for f P = 0.002, 8 × 10⁻⁴, 0.001, for g P = 0.01, 5 × 10⁻⁶, for h P = 0.004, 0.02, two-tailed t-test.

