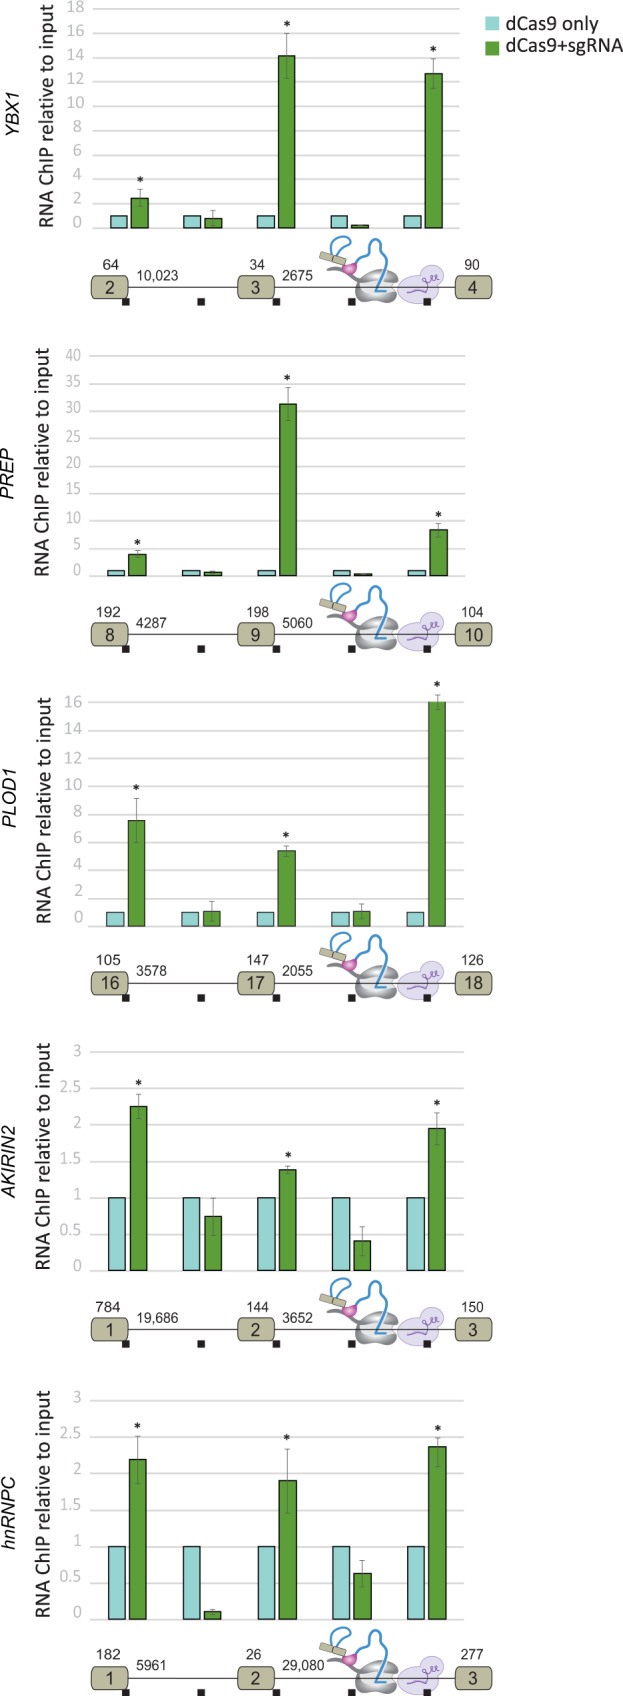
Fig. 2. The 5′SSs of endogenous pre-mRNAs are associated with pol II located in the middle of the downstream intron.

The CRISPR interference-based protocol was used to evaluate five endogenous genes (as shown in Fig. 1e). Exon numbers and intron and exon lengths are indicated. Mean RNA levels were measured. N = 3 independent experiments. Each bar corresponds to the amplified segment marked in the gene diagram below the graph. Error bars show mean values ± SEM. Asterisk indicates from left to right for YBX1 P = 0.05, 0.002, 8 × 10⁻⁴, for PREP P = 0.01, 5 × 10⁻⁴, 0.004, for PLOD1 P = 0.01, 3 × 10⁻⁴, 5 × 10⁻⁴, for AKIRIN2 P = 0.002, 0.002, 0.01, for hnRNPC one-tailed t-test P = 0.01, 0.03, 0.001, two-tailed t-test.
