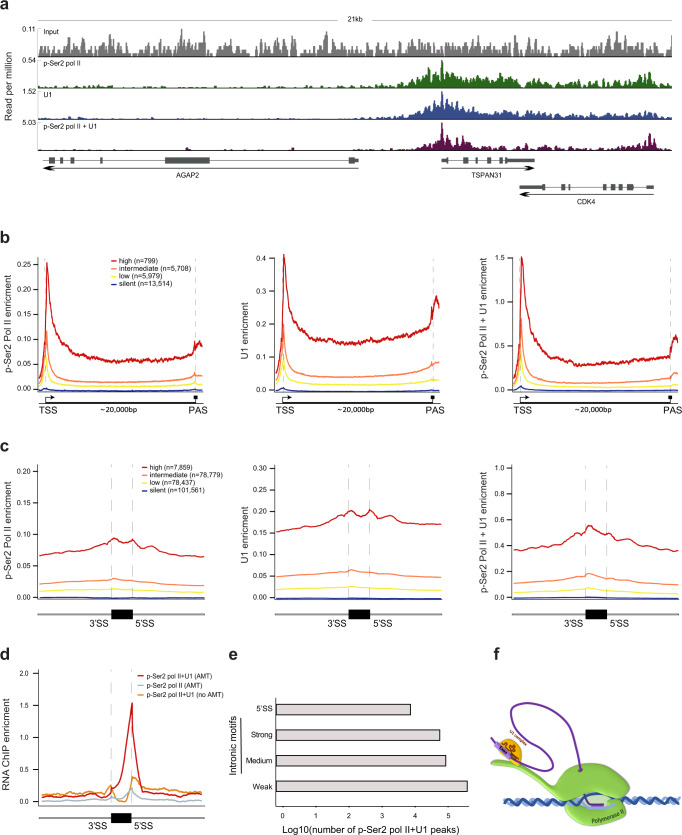
Fig. 4. p-Ser2 pol II and U1 snRNP travel together during transcription and are linked to 5′SS regions.
a Signals from ChIP-seq using p-Ser2 pol II antibody alone (green), U1C antibody alone (blue), or p-Ser2 pol II antibody followed by U1C antibody (purple) over a representative region of the HEK293 genome containing transcribed and untranscribed genes compared to input (gray). b p-Ser2 pol II, U1C, and p-Ser2 pol II-U1C occupancy over genes in HEK293 cells. Genes were divided based on expression (fpkm) into high (red), intermediate (orange), low (yellow), and silent (green). The signal is shown across 22,000 bp. Genes were scaled to 20,000 bp; 1000 bp upstream of the transcription start site and 1000 bp downstream of the polyadenylation site are shown. c p-Ser2 pol II, U1C, and p-Ser2 pol II-U1C occupancy over exons and 500 bp of the flanking intron sequences in HEK293 cells with genes grouped by expression level. Exons were scaled to 150 bp. One replicate for all ChIP-seq experiments. d RNA-ChIP profile over internal exons with 5′SS peaks and their 500 bp flanking introns in HEK293 cells for double RNA-ChIP using p-Ser2 pol II antibody followed by U1C antibody with AMT treatment (red), for single RNA-ChIP using p-Ser2 pol II antibody with AMT treatment (gray), and for double RNA-ChIP without AMT treatment (orange). Signals are normalized to input. e The number of pol II-U1C RNA-ChIP peaks on canonical 5′SS and on putative intronic 5′SS sites. Putative sites are divided according to their 5′SS motif strength. RNA-ChIP-seq experiments were done in duplicate. f Schematic model of 5′SS association with pol II via base pairing with U1 snRNA during intron synthesis.

