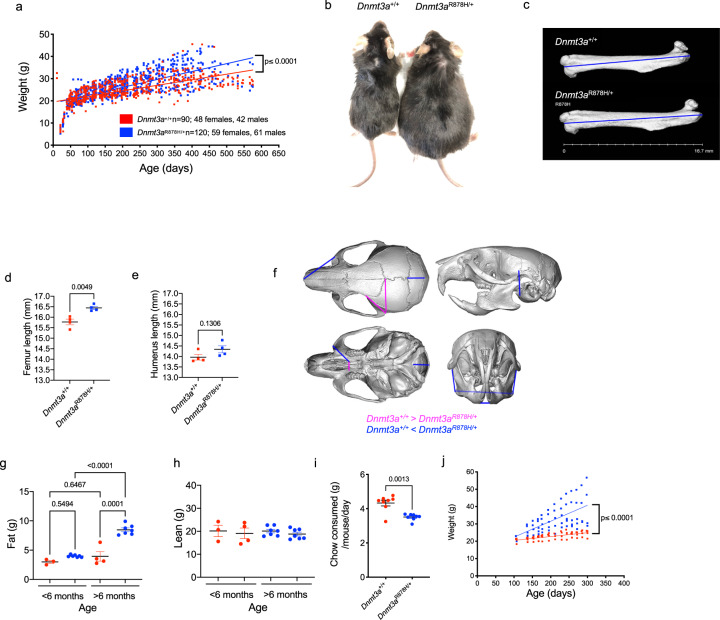
Fig. 3. Germline Dnmt3aR878H/+ mice exhibit overgrowth and obesity.
a Weight in grams of Dnmt3a+/+ control mice (red, n = 90) and Dnmt3aR878H/+ mice (blue, n = 120) from weaning (day 21) to 575 days of age. Linear regression analysis was used to determine differences between genotypes (p ≤ 0.0001). b Representative image of age and gender-matched littermate Dnmt3a+/+ (30.9 g) vs. Dnmt3aR878H/+ (59.45 g) mice highlighting a typical size difference at 1 year of age. c Representative CT images of femurs from whole mouse imaging. Measurements of femur length (mm) in Dnmt3a+/+ and Dnmt3aR878H/+ age-matched controls are shown (n = 4 each genotype). d Quantification of femur lengths (mm) measured as shown in b (n = 4 biologically independent samples/genotype, P = 0.0049 by two-tailed t test). e Quantification of humerus lengths (mm) in the same mice, measured by CT scan (n = 4 biologically independent samples/genotype, p-value by two-tailed t test). f Reconstructions of cranium and mandible from CT scans of Dnmt3a+/+ and Dnmt3aR878H/+ mice showing landmarks of differences in size and angles. g The MRI quantification of body fat composition of age-matched Dnmt3a+/+ (red, n = 4) and Dnmt3aR878H/+ (blue, n = 7) pairs separated by age (less or greater than 6 months), to highlight age-dependent increases in body fat (P-values by two-way ANOVA with Tukey’s multiple comparisons test are indicated). h The MRI quantification of lean body mass composition of age-matched Dnmt3a+/+ (red, n = 4) and Dnmt3aR878H/+ (blue, n = 7) pairs separated by age (less or greater than 6 months). i Quantification of chow consumed (calculated as grams of chow per mouse per day) for age-matched Dnmt3a+/+ (red, n = 8) and Dnmt3aR878H/+ (blue, n = 8) mice (P = 0.0013 by two-tailed t test). j Weight tracking in grams of Dnmt3a+/+ control mice (red, n = 4) and Dnmt3aR878H/+ mice (blue, n = 6) fed a high-fat diet from 100 to 300 days of age. Linear regression analysis was used to determine differences between genotypes (p ≤ 0.0001). For d, e, g-i error bars show mean ± SEM. g grams, mm millimeter.

