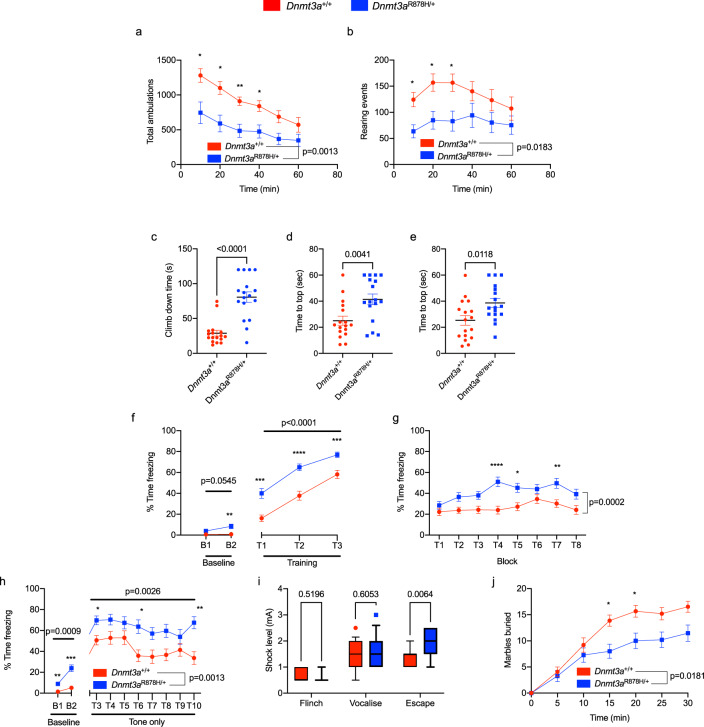
Fig. 4. Germline Dnmt3aR878H/+ mice exhibit behavioral alterations.
a Total ambulations during 1-hour open-field testing, split into 10-minute intervals (p = 0.0013 effect by genotype, F(1,32) = 12.5, n = 17,17; two-way repeated-measures ANOVA with Šídák’s multiple comparison test). b The number of rearing events during 1-hour open-field testing, split into 10-minute intervals (p = 0.0183 effect by genotype, F(1,32) = 6.183, n = 17,17; two-way repeated-measures ANOVA with Šídák’s multiple comparison test). Dnmt3aR878H/+ mice take significantly longer to c climb down a pole (p ≤ 0.0001, n = 17,17; unpaired t test), reach the top of a d 60° inclined screen (p = 0.0041, n = 17,17; unpaired t test) and e 90° inclined screen (p = 0.0118, n = 17,17; unpaired t test). Panels f–h The percentage of time freezing in f conditioned fear training (cue: p ≤ 0.0001 genotype effect, F(1,31) = 28.02, n = 16,17; two-way repeated-measures ANOVA with Šídák’s multiple comparison test), g contextual fear trials (p = 0.0002 genotype effect, F(1,31) = 18.53, n = 16,17; two-way repeated-measures ANOVA with Šídák’s multiple comparison test) and h cued fear trials (baseline: p = 0.0009 genotype effect, F(1,31) = 31.02; cue: p = 0.0026 genotype effect F(1,31) = 10.76, n = 16,17; two-way repeated-measures ANOVA with Šídák’s multiple comparison test). i Minimum shock needed to exhibit a behavioral response in mice during conditioned fear test (escape: p = 0.0064 genotype effect F(1,31) = 5.094, n = 16,17; two-way repeated-measures ANOVA with Šídák’s multiple comparison test). The box extends from 25th to 75th percentile, the line indicates median and whiskers show 10th to 90th percentile. j Marbles buried in 30 min (5 min bins, p = 0.0181, genotype effect F(1,28) = 6.307, n = 15,15; two-way repeated-measures ANOVA with Šídák’s multiple comparison test). *p ≤ 0.05, **p ≤ 0.01, ***p ≤ 0.001, ****p ≤ 0.0001. The line and bar graphs indicate the mean and SEM for each value tested. min minutes, s seconds, mA milliamps.

