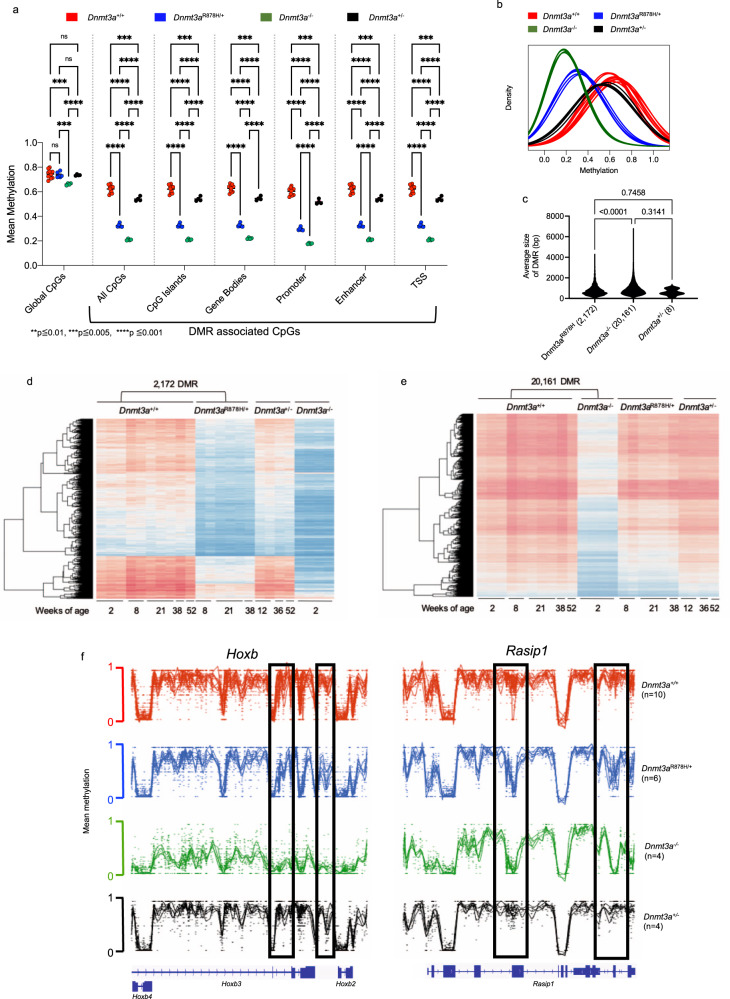
Fig. 5. Germline Dnmt3aR878H/+ mice exhibit focal, canonical DNA hypomethylation in bone marrow cells.
a The mean methylation values for both global CpGs, and DMR-contained CpGs, in annotated regions of the genome are shown. Hypothesis testing was performed using two-way repeated-measures ANOVA with Tukey’s multiple comparison test within each genomic region. b The density plot of methylation values from whole-genome bisulfite sequencing (WGBS) for differentially methylated regions (DMRs) defined by comparing Dnmt3a+/+ and germline Dnmt3aR878H/+ for each whole bone marrow sample from Dnmt3a+/+ (red, n = 10), Dnmt3aR878H/+ (blue, n = 6), Dnmt3a+/- (black, n = 4) and Dnmt3a-/- mice (green, n = 4). c The mean size (bp) for all DMRs identified in Dnmt3aR878H/+ (n = 2,172), Dnmt3a+/- (n = 8), and Dnmt3a-/- (n = 20,161) bone marrow cells when independently compared to Dnmt3a+/+ controls (P-values by one-way ANOVA with Tukey’s multiple comparisons test shown). d The heatmap showing mean methylation values for the 2172 DMRs defined in Panel b for each individual Dnmt3a+/+ and Dnmt3aR878H/+ sample. Values for the same DMRs were plotted passively for Dnmt3a+/- and Dnmt3a-/- samples. e The heatmap showing mean CpG methylation values for the 20,161 DMRs defined by comparing the Dnmt3a+/+ and Dnmt3a-/-samples. Values for the same DMRs were plotted passively for Dnmt3aR878H/+ and Dnmt3a+/-. f Examples of Dnmt3a-dependent hypomethylated regions in the Hoxb cluster (left) and the Rasip1 gene (right). The locations of DMRs in each gene are indicated in boxes. DMR differentially methylated region, bp base pairs, TSS transcriptional start site.

