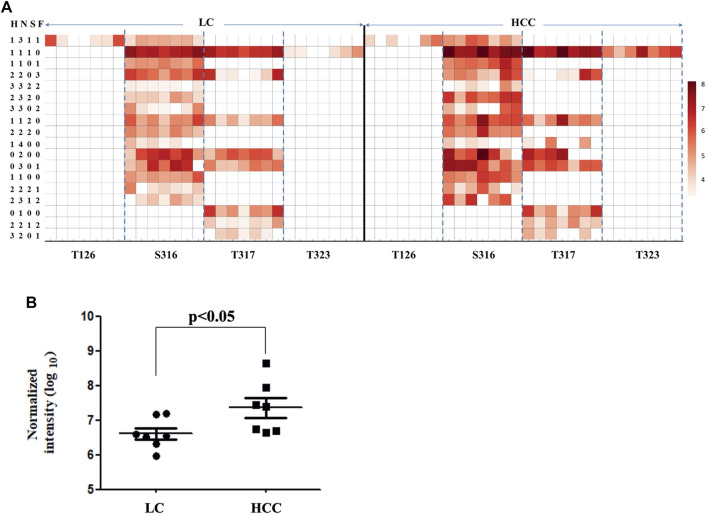
FIGURE 3.
Abundance of Hp O-glycopeptides in LC and HCC. (A) Intensity distributions of Hp O-glycopeptides in seven HCC and seven LC patients. The X-axis represents identified O-glycosylation sites of Hp. The Y-axis represents the intensity (Log10 conversion) of different glycoforms in Hp. (B) Label-free quantification of HYEGS 316TVPEK (H1N1S1) of Hp and the difference was statistically significant.

