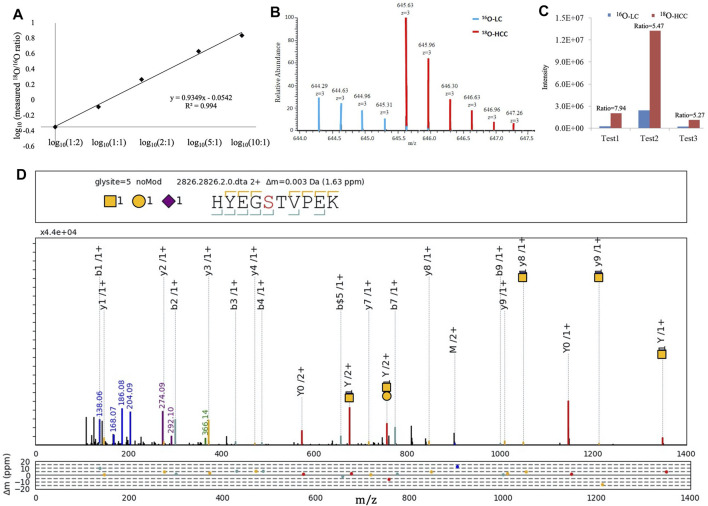
FIGURE 4.
16O/18O C-terminal labeling for quantification of Hp O-glycopeptides. (A) Series of theoretical ratios of Hp O-glycopeptide standard (1:2, 1:1, 2:1, 5:1, and 10:1) was applied, and experimental ratios showed good linearity with a correlation coefficient (R 2) approximate of 0.99. (B) Representative MS1 spectrum of HYEGS 316TVPEKK (H1N1S1). (C) Three biological repeats were performed, and the average fold change (HCC/LC) of this O-glycopeptide was about 6.2. (D) Representative MS2 spectrum was shown using the gLabel software tool. The O-glycosylation site is “S.” The glycan symbols are as follows: purple diamond for sialic acid (S), yellow circle for hexose (H), and yellow square for N-acetylhexosamine (N). The glycan composition and peptide sequence are in the upper box of each spectrum. The peak annotations are displayed in the middle box containing fragment ions of the glycan part or diagnostic glycan ions (green, blue, and purple), y-ions from glycan fragmentation (red), and the b/y ions from peptide backbone fragmentation (yellow/cyan). Mass deviations in the annotated peaks are displayed in the box below.

