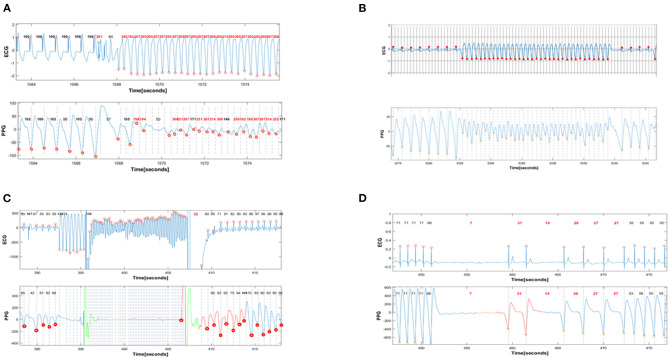
Figure 1.
Simultaneous PPG and ECG recordings during provoked arrhythmias. In all panels, the red dots denote the timing of automatic detection of a QRS complex (R-R intervals) or a PPG signal (G-G intervals). The interval between red dots dictates the R-R (and G-G) interval that is automatically detected and annotated as beat-to-beat heart rate in beats/min. (A) shows the induction of monomorphic VT with programmed ventricular stimulation. The first 6 complexes are ventricular paced beats with a basic cycle length of 600 msec. All these beats are appropriately detected by PPG, with a heart rate of 100 beats/min in the ECG recorder and 98 −102 betas/min in the PPG recorder. Then there are 3 beats of ventricular extrastimulation with very short coupling interval. Only one of these 3 extrastimuli is detected by PPG. This is followed by an induced fast sustained VT (ventricular rate 210 beats/min). Except for the initial 9 beats of VT, almost all subsequent cardiac beats are also detected with a rate >200/min by PPG signals. (B): Spontaneous ventricular tachycardia with a rate of 215 beats/min that terminates spontaneously after 10 s. All sinus complexes and all VT complexes detected by the ECG are also detected by PPG. Note the immediate decrement and subsequent alternans in PPG amplitude during VT, reflecting the reduced cardiac output during VT. Nevertheless, there is appropriate detection of VT by the PPG recorder. (C): Induction of VF during ICD implantation. During sinus rhythm, eight beats of ventricular pacing are followed by a low energy shock delivered on the T-wave to induce VF that is eventually terminated by the ICD shock. The VF is falsely detected as “asystole” by PPG. (D): Induced transient complete AV block provoked by adenosine and leading to 9 s of ventricular asystole. The prolonged ventricular asystole, as well as shorter subsequent pauses, are correctly detected by PPG.

