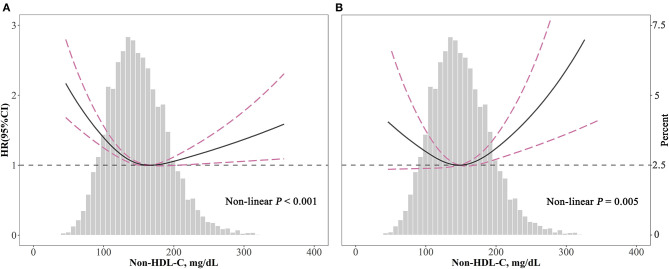
Figure 3.
Spline analyses of all-cause (A) and cardiovascular (B) mortality by non-HDL-C in the overall cohort and the probability distribution histogram is represented in the background [spline analyses were adjusted for age, gender, race, smoking, body mass index, systolic blood pressure, diabetes, and medicine use (antihypertensive drugs, hypoglycemic agents, and lipid-lowering drugs)].

