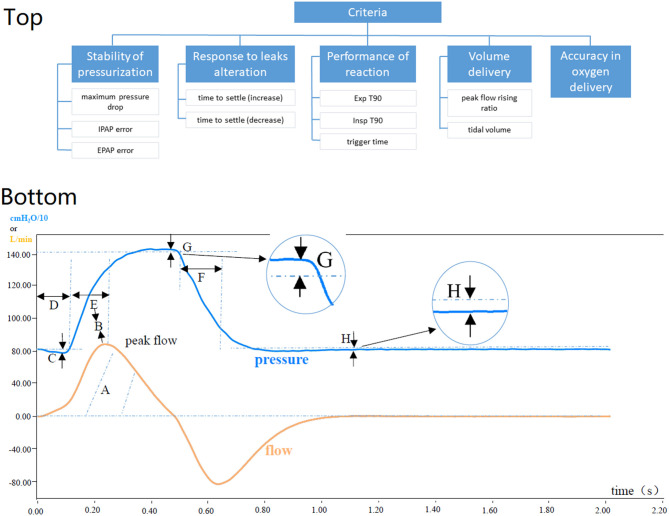
Figure 1.
(Top) Illustration of the analytic hierarchy process hierarchy. (Bottom) explanation of the evaluated parameters. (Top) EPAP, expiratory positive airway pressure; IPAP, inspiratory positive airway pressure; Exp T90, the time to accomplish 90% of the drop from peak pressure to EPAP; Insp T90, the time to accomplish 90% of the rise to IPAP. For detailed explanation of the nodes, please refer to the text. (Bottom) A, Tidal volume: The volume of gas the user inhales; B, Flow efficiency: Peak flow divided by the length of Insp T90; C, Maximum pressure drop: Deflection of airway pressure from baseline (EPAP) to Pmin; D, Time to trigger: Point in time at which airway pressure has returned to baseline (EPAP) after a downward deflection; E, Insp T90: The time to accomplish 90% of the rise to IPAP; F, Exp T90: The time to accomplish 90% of the drop from peak pressure to EPAP; G, IPAP error: The difference between Ppeak and the set IPAP; H, EPAP error: The difference between the positive end-expiratory pressure and the set EPAP.

