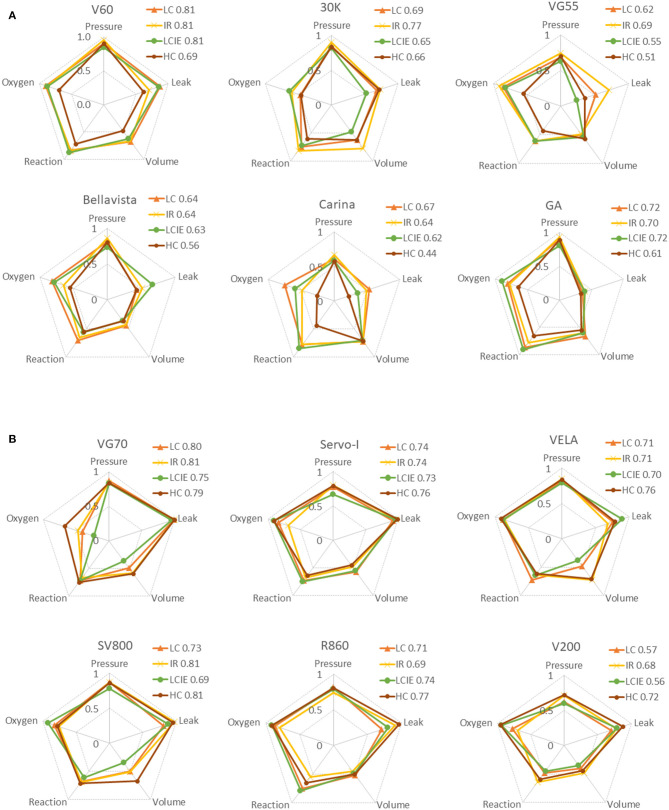
Figure 4.
Radar charts summarizing the main criteria of the performance evaluation. Data are expressed as the score calculated based on the proposed scoring system. Scores for three simulated COVID-19 phenotypes are superimposed on the same chart (IR, increased airway resistance; LC, low compliance; LCIE, low compliance plus increased respiratory effort; HC, high compliance). The following five characteristics are summarized for each ventilator (clock-wise): the stability of pressurization (pressure), response to leaks alteration (leak), volume delivery (volume), performance of reaction (reaction), and accuracy in oxygen delivery (oxygen). (A) Non-invasive ventilators with single-circuit connection. (B) ICU ventilators with non-invasive ventilation mode and double-circuit connection.

