FIGURE 15.

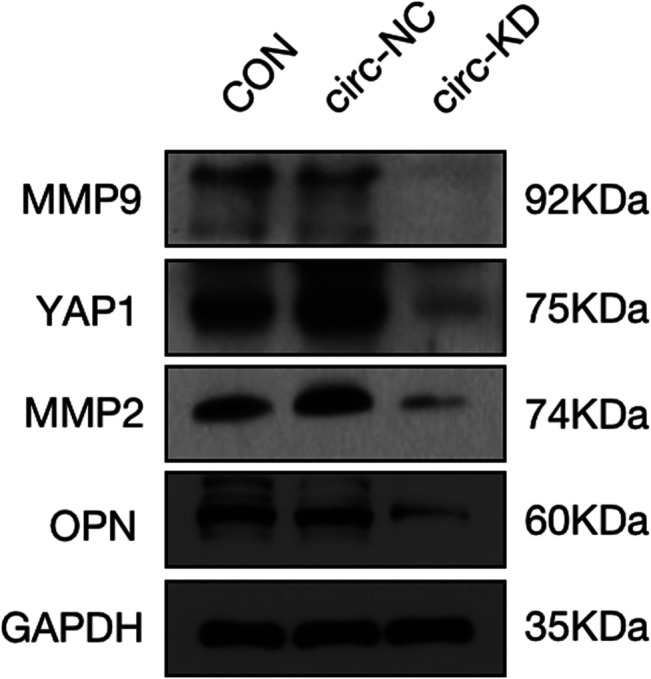
Protein expression level of MMP2, MMP9, YAP1, OPN and GAPDH assessed by western blot. GAPDH served as internal control. CON = control,KD = knockdown of hsa_circ_0005505, NC = negative control.

Protein expression level of MMP2, MMP9, YAP1, OPN and GAPDH assessed by western blot. GAPDH served as internal control. CON = control,KD = knockdown of hsa_circ_0005505, NC = negative control.