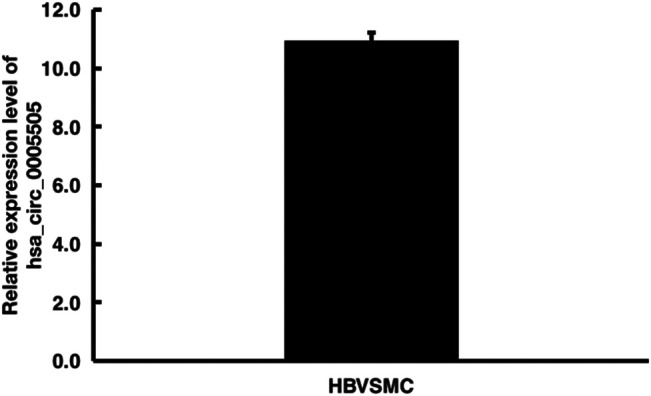
FIGURE 6.

Quantitative real-time PCR analysis of hsa_circ_0005505 expression level in HBVSMCs. GAPDH was regarded as the reference gene. △Ct value = Ct value of target gene - Ct value of reference gene. △Ct value ≤ 12 represents the high expression of target gene in cells, △Ct value ≥ 16 represents the low expression of target gene in cells.
