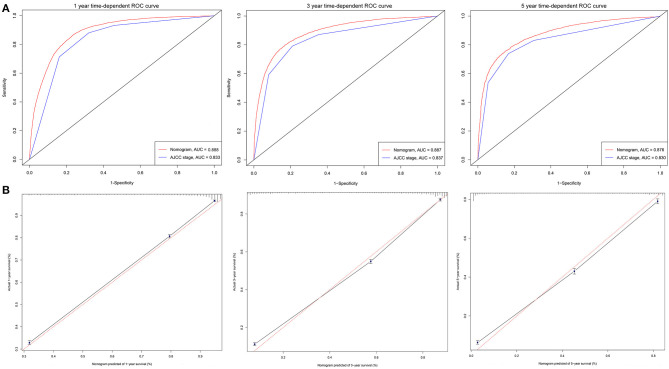
Figure 4.
ROC curves and calibration plots for predicting patients-specific survival at 1-, 3-, and 5-year in the training cohorts. (A) ROC curves of the Nomogram and AJCC stage in prediction of prognosis at 1-, 3-, and 5-year point in the training set. (B) The calibration plots for predicting patient survival at 1-, 3-, and 5-year point in the training set. ROC, receiver operating characteristic curve; AUC, areas under the ROC curve.

