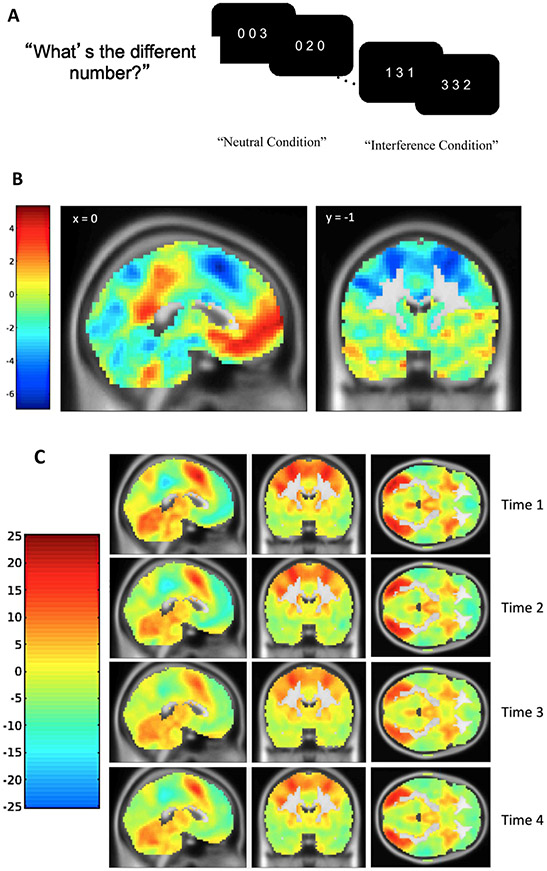
Fig. 1. Schematic Display of the Multi-Source Interference Task (MSIT) and Activation Maps Showing Significant Activation for the Interference-Neutral Contrast.
Note: A) Adolescents were instructed to identify the different digit while ignoring its position. B) Statistical T map showing regions of positive and negative linear change in the interference effect on BOLD responses with time point using the Sandwich Estimator Toolbox after applying a gray matter mask. C) Statistical T maps showing regions of positive (interference > neutral) and negative (neutral > interference) interference effect for each time point after applying a gray matter mask.

