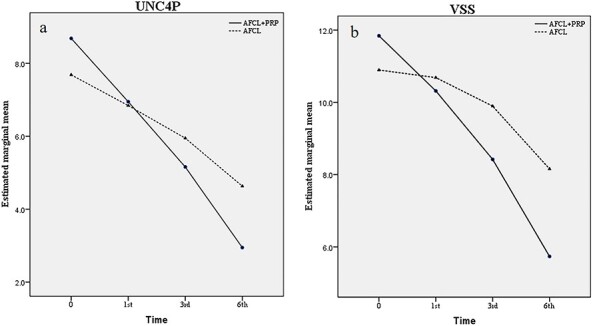
Figure 3.

Estimated marginal mean UNC4P (a) and VSS (b) scores by time. The decrease of UNC4P (a) and VSS (b) scores were observed in different treatment groups; however, the UNC4P scores in AFCL+PRP group showed a more obvious downward trend than that in AFCL group (a), and the different downward trend was statistically significant (difference, −1.68; 95% confidence interval (CI), −2.47, −0.80; p < 0.001). The VSS score showed a similar downward trend in AFCL+PRP group and AFCL group (difference, −2.42; 95% CI, −3.68, −1.16; p < 0.001). UNC4P University of North Carolina 4P Scar Scale, VSS Vancouver Scar Scale
