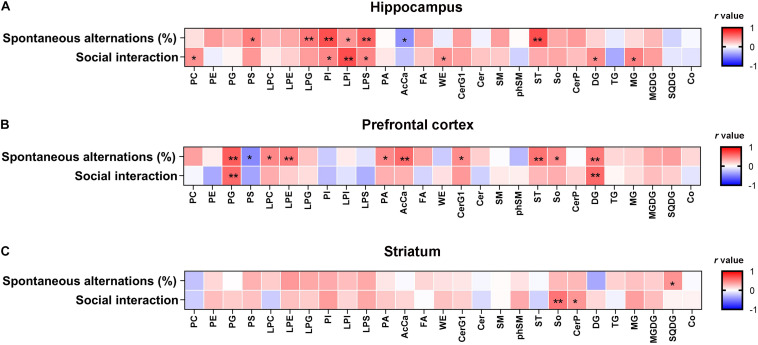
FIGURE 3.
Correlation analysis between cognitive behavior and the lipid levels in the hippocampus, PFC, and striatum. (A) The hippocampal PI, PS, LPI, and LPS levels were negatively correlated with the severity of cognitive behavioral impairment. (B) The PFC AcCa, DG, and PG levels were negatively correlated with the severity of the cognitive behavioral impairment. (C) The striatum SQDG level was positively correlated with the percentage of spontaneous alternations and So levels was positively correlated with the percentage of interaction time. The correlation between the lipid levels and cognitive behavior was analyzed using the Pearson’s correlation coefficient. *P < 0.05, **P < 0.01.

