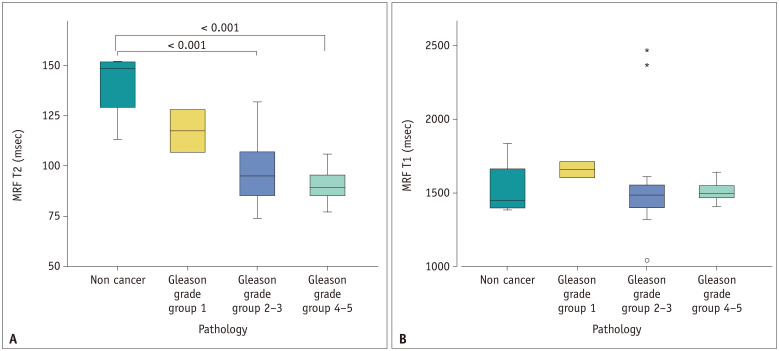
Fig. 4. Differences in MRF-derived T1 and T2 values according to the pathology results.
A, B. The graph shows that the higher the cancer grade, the lower the T2 value (A). The T2 value in non-cancerous lesions was significantly higher than that in Gleason grades 2–3 and 4–5 lesions. There was no significant difference in T1 values according to the pathology results (B). MRF = MR fingerprinting

