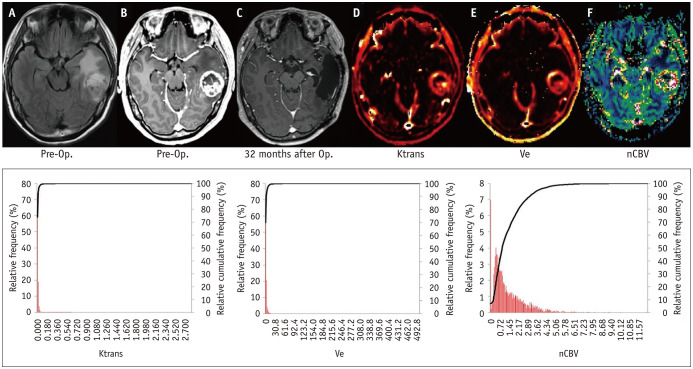
Fig. 5. Lack of progression (predicting EP = 37 months) in a 56-year-old female with GBM.
A-F. An enhancing mass with internal necrosis and non-enhancing, T2 HSI lesions at the left temporal lobe is demonstrated on baseline structural FLAIR (A) and contrast-enhanced T1WI (B) as well as the perfusion and permeability parametric maps of Ktrans (D), Ve (E) and nCBV (F). After total surgical removal of the contrast-enhancing area of the GBM (not shown) and the completion of concomitant chemoradiotherapy with adjuvant temozolomide, this patient was diagnosed with nonprogression on a follow-up MRI (C) performed 32 months after surgery. The cumulative histograms of the perfusion and permeability parameters (Ktrans, Ve, and nCBV) are shown at the bottom row of the figure. The red bars and black lines indicate the relative frequencies of the perfusion and permeability parameters in the non-enhancing, T2-HSI lesions. The cumulative histograms of Ktrans and Ve show a left shift relative to those in figure 4, which means that the non-EP group has lower parametric values than the EP group. In this patient, the 95th PV of Ktrans and the mean Ktrans values were 0.02 min-1 and 0.005 min-1, respectively, which were lower than those of the patient in figure 4. EP = early progression, FLAIR = fluid-attenuated inverse recovery, GBM = glioblastoma, HSI = high-signal-intensity, nCBV = normalized relative cerebral blood volume, Op. = near total resection of contrast-enhancing portion, T1WI = T1-weighted image

