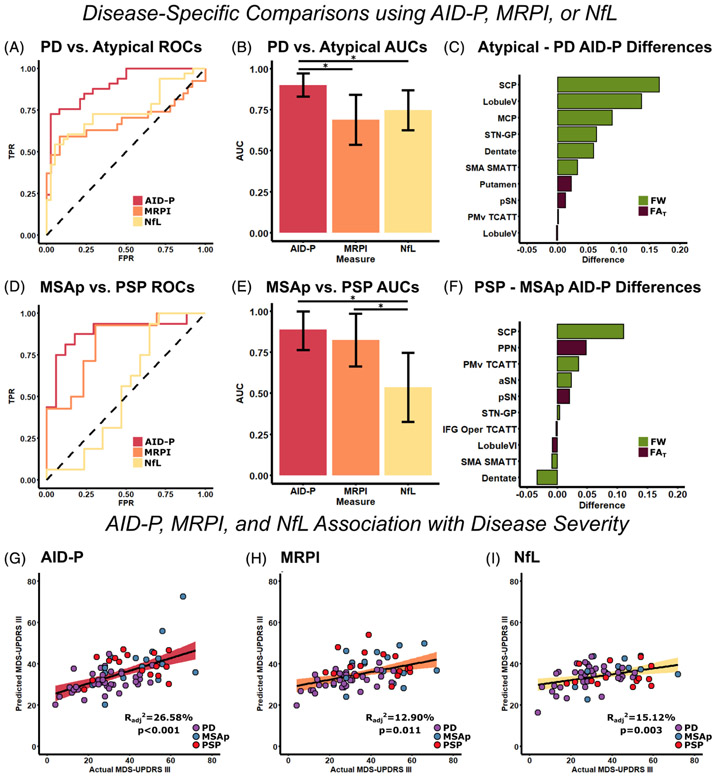
FIG. 1.
Unimodal prediction of disease state and disease severity using AID-P, MRPI, and NfL. ROC curves were created for the AID-P (red), MRPI (orange), and NFL (yellow) measures for PD versus MSAp/PSP (A), and the AUC value for each curve was quantified (B). The FW (green) and FAT (purple) difference between MSAp/PSP and PD was quantified for the top 10 contributors to the AID-P PD versus MSAp/PSP machine-learning model (C). The same analyses were repeated for MSAp versus PSP (D–F). Stepwise regression was conducted to determine the best set of variables to predict disease severity for AID-P (G, red), MRPI (H, orange), and NfL (I, yellow).*Significance at P < 0.05 and error bars represent 95% confidence intervals. AID-P, Automated Imaging Differentiation in Parkinsonism; aSN, anterior substantia nigra; AUCs, areas under the curve; FAT, FW-corrected fractional anisotropy; FW, free-water; IFG, inferior frontal gyrus; MSAp, multiple system atrophy; MDS-UPDRS III, Part III of the Movement Disorders Society Unified Parkinson’s Disease Rating Scale; MRPI, Magnetic Resonance Parkinsonism Index; MSAp, multiple system atrophy parkinsonian variant; NfL, neurofilament light chain protein; PD, Parkinson’s disease; pSN, posterior substantia nigra; PSP, progressive supranuclear palsy; ROCs, receiver operating characteristics; SMA, supplementary motor area; SMATT, sensorimotor area tract template; STN-GP, subthalamic nucleus-globus pallidus; TCATT, transcallosal tract template; TPR, true positive rate.

