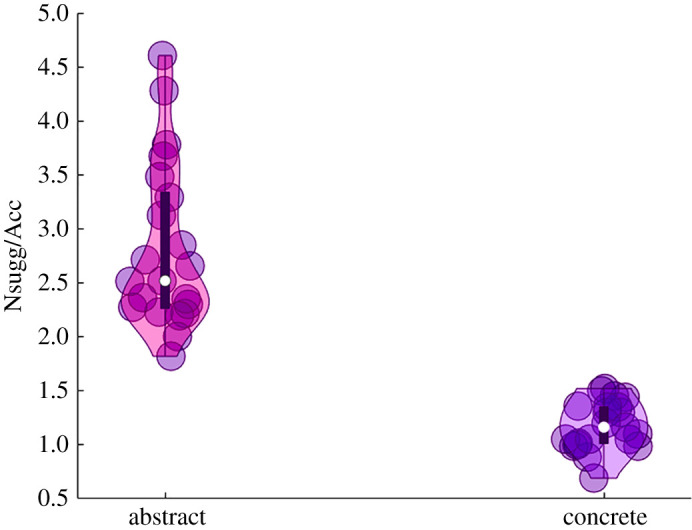
Figure 3.

Results of the Objective helping index. Paired sample T-test on the Objective helping index showed a significant difference between ACs and CCs (t(20) = 10.24, p < 0.001). Participants showed a higher value of the Objective helping index, which is the ratio between the averaged category suggestions required and the averaged category accuracy. Violin plots display box plots, data density and single subjects' values (dots).
