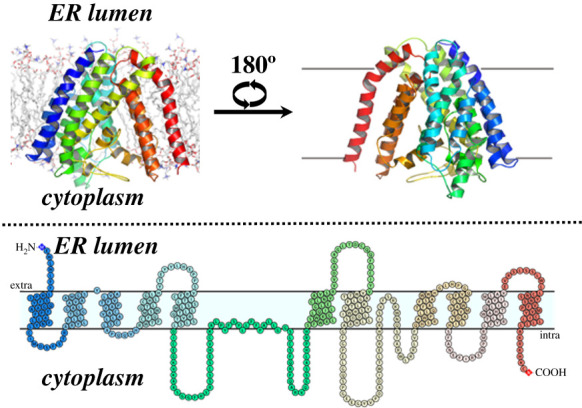
Figure 6.

Computational model of human GOAT structure. The structure of hGOAT is shown in an ER-mimetic lipid membrane, with helices colour coded to the accompanying membrane topology diagram. Figure reproduced from reference [115] under the terms of the Creative Commons CC-BY licence.
