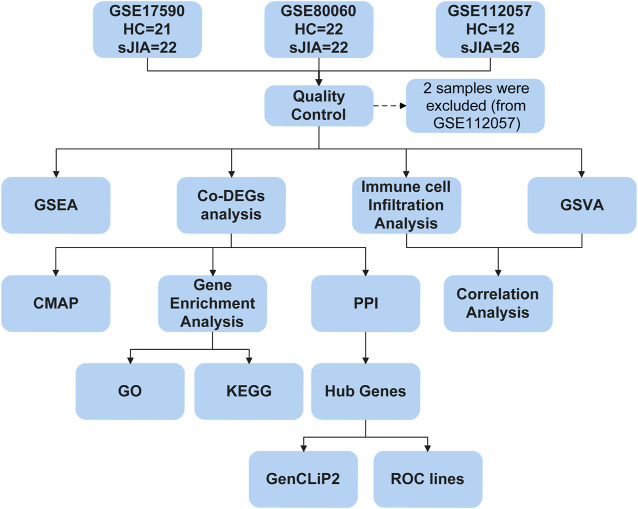
FIGURE 1.
Flow chart of the bioinformatic analysis process. HC, healthy control; sJIA, systemic juvenile idiopathic arthritis; GSEA, gene set enrichment analysis; Co-DEGs, common differentially expressed genes; GSVA, gene set variation analysis; CMAP, connectivity map; PPI, protein-protein interaction; GO, Gene Ontology; KEGG, Kyoto Encyclopedia of Genes and Genomes; ROC, receiver operating characteristic.

