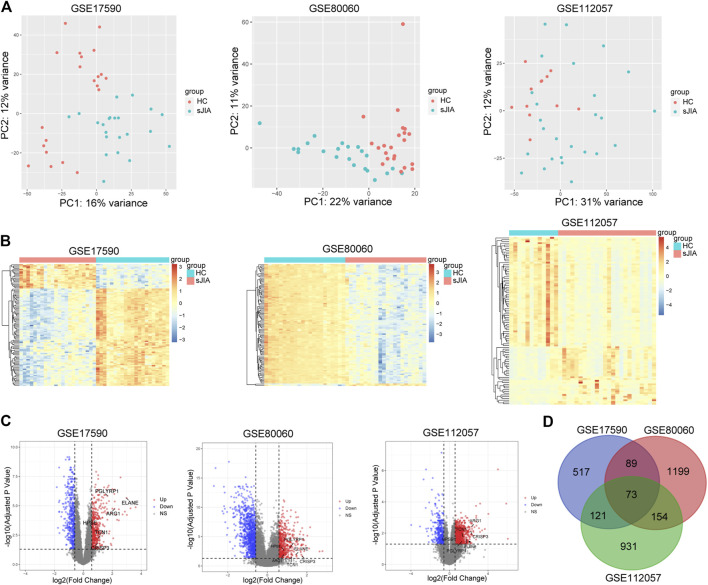
FIGURE 2.
PCA plots and differential analysis of GSE17590, GSE80060, and GSE112057. (A) PCA plots of the three datasets. Each point in the scatter plots represents a GSM sample. (B) Heat maps of the top 100 DEGs between HC and sJIA patients. (C) Volcano plots of the DEGs between HC and sJIA patients. The blue dots represent significantly downregulated genes the red dots significantly upregulated genes in sJIA patients; hub genes are marked. (D) Venn diagram showing overlapping DEGs of the three datasets. PCA, principal component analysis; DEGs, differentially expressed genes; HC, healthy control; sJIA, systemic juvenile idiopathic arthritis.

