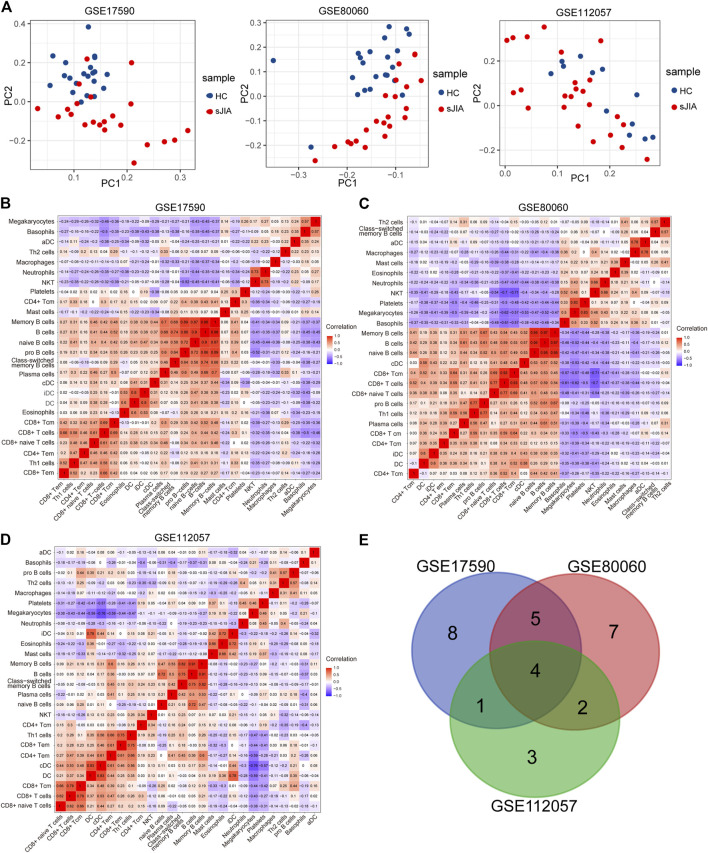
FIGURE 6.
Analysis of immune cells between HCs and sJIA patients. (A) PCA using GSE17590, GSE80060, and GSE112057 to uncover differences in immune phenotypes between HC and sJIA patients. (B-D) Correlation heat maps of immune cells in the three datasets. (E) Venn diagram showing overlapping immune cells between HCs and sJIA patients. PCA, principal component analysis; HC, healthy control; sJIA, systemic juvenile idiopathic arthritis.

