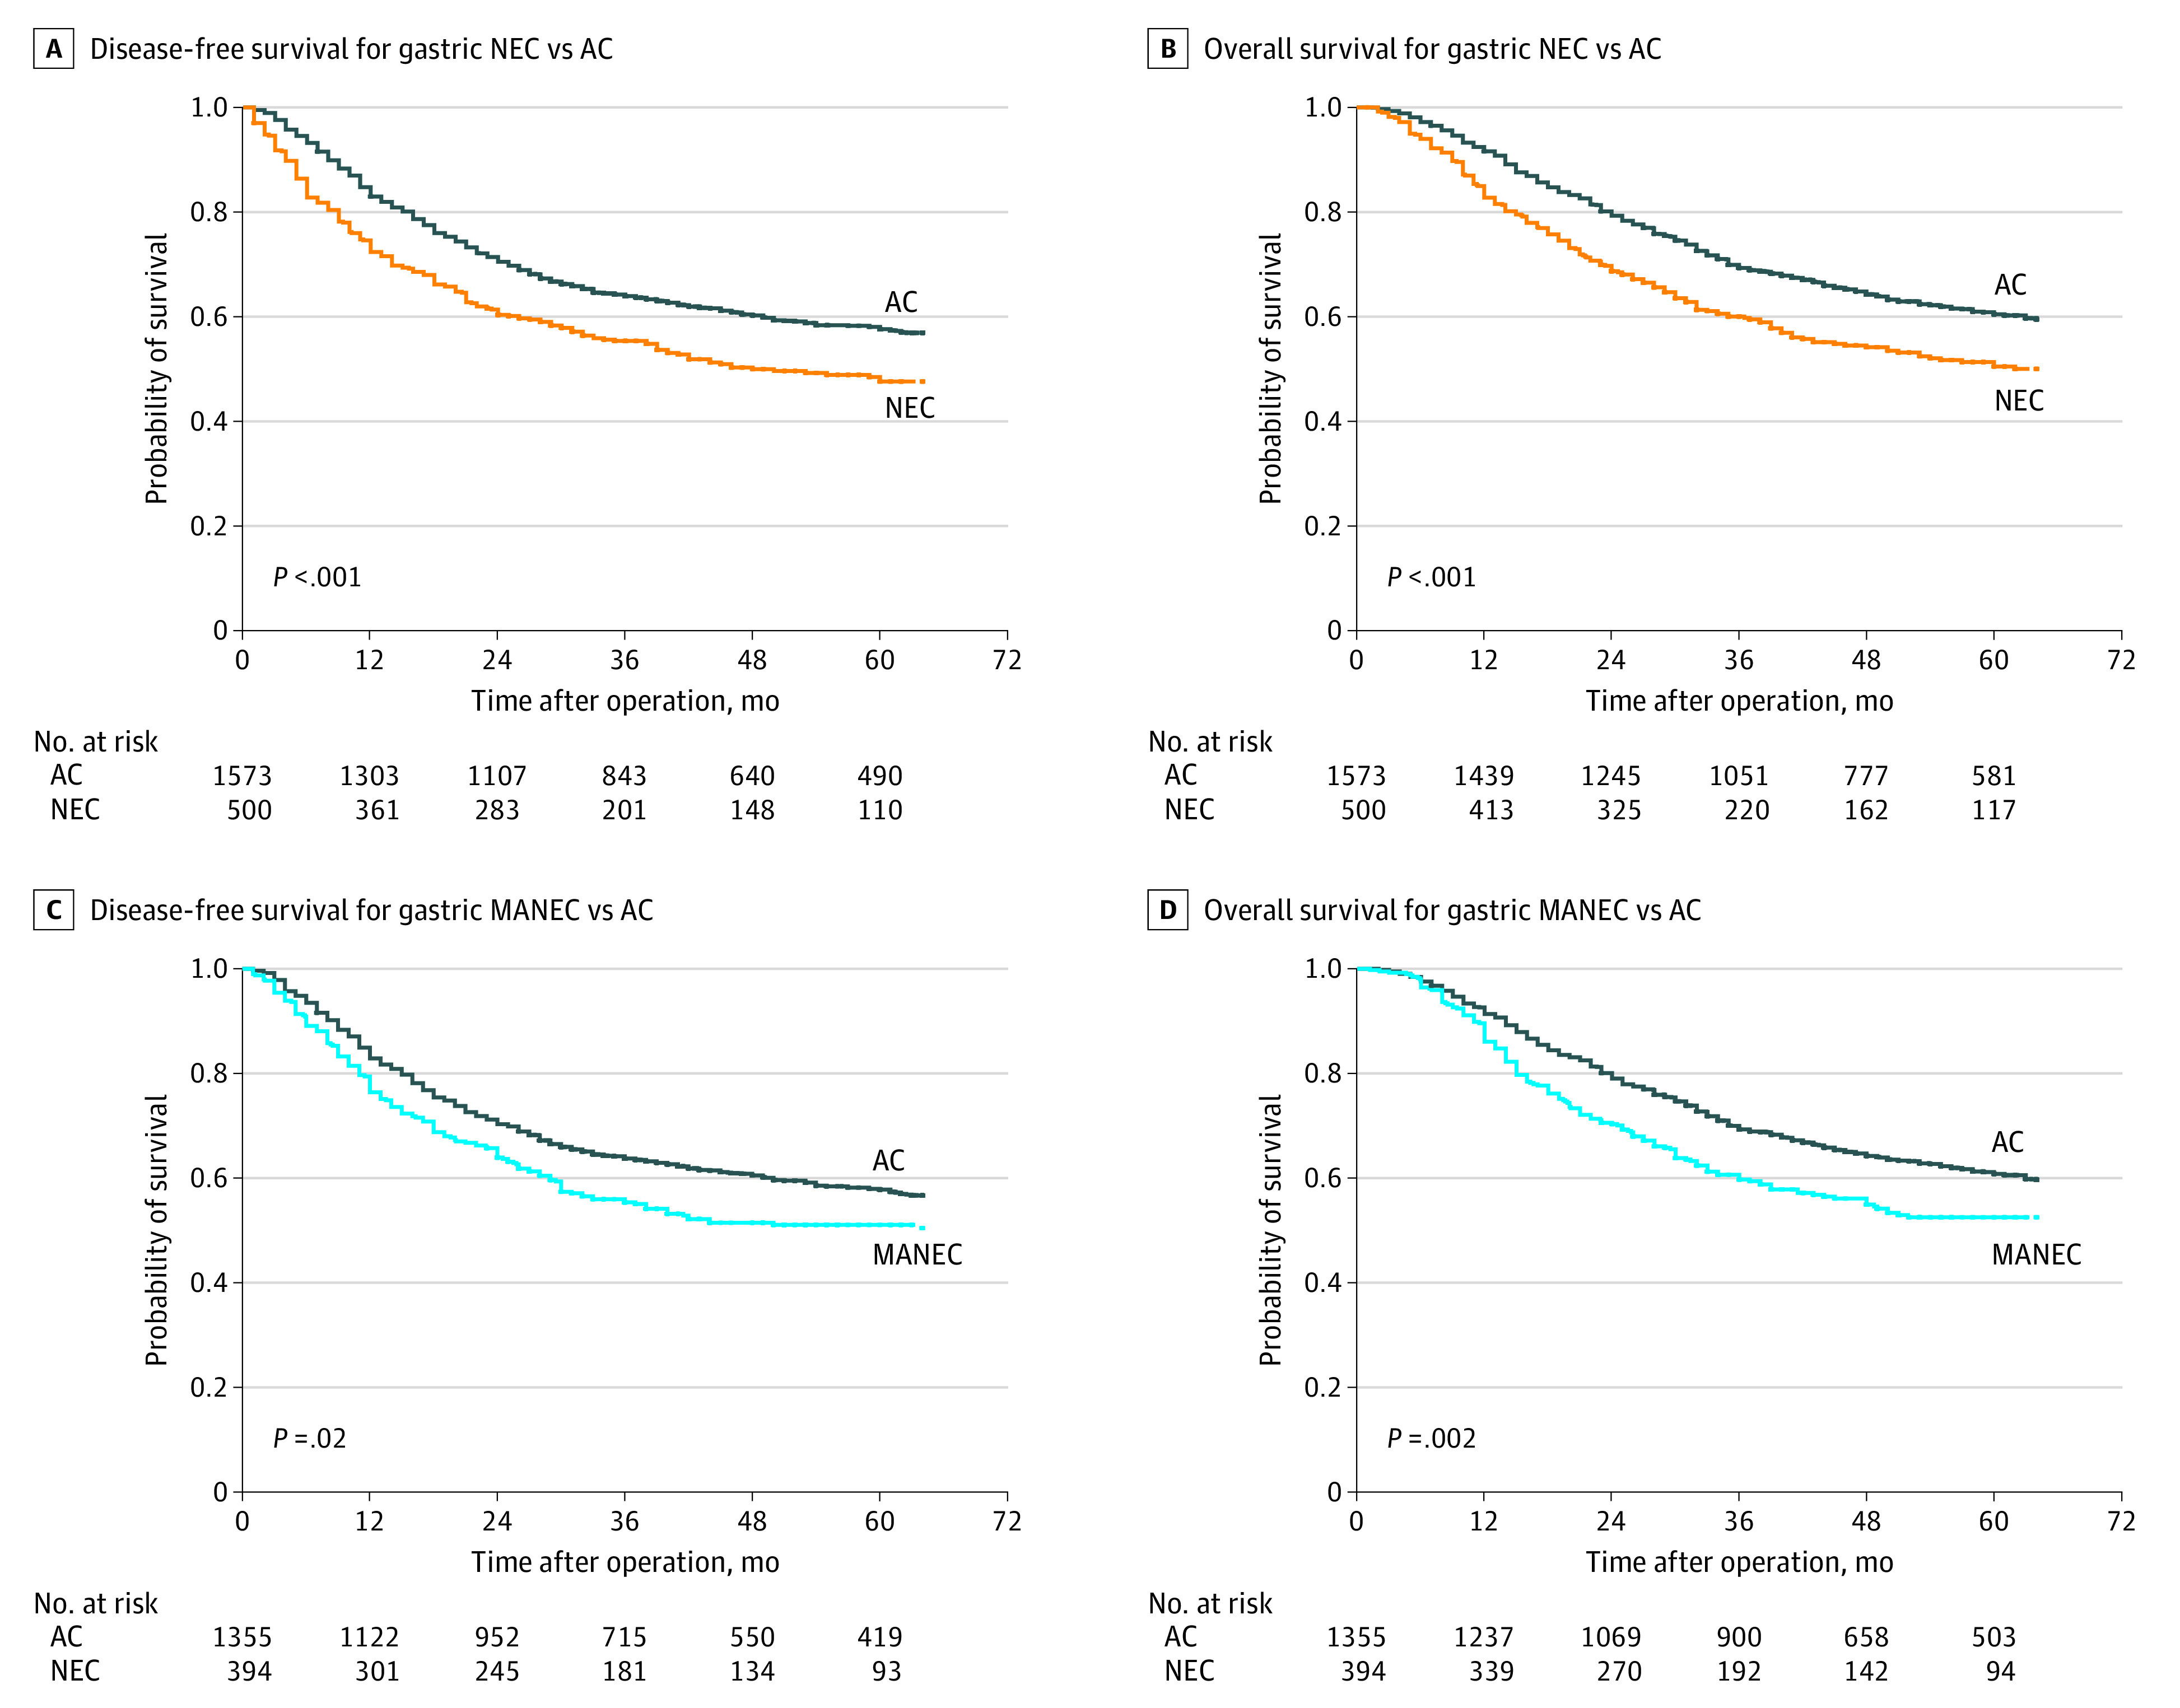
Figure. Kaplan-Meier Survival Curves for Patients With Different Histologic Subtypes of Gastric Carcinoma in the Matched Data.

AC indicates adenocarcinoma; MANEC, mixed adenoneuroendocrine carcinoma; and NEC, neuroendocrine carcinoma.

AC indicates adenocarcinoma; MANEC, mixed adenoneuroendocrine carcinoma; and NEC, neuroendocrine carcinoma.