
Figure 7. Nestin Staining and Survival Analysis.
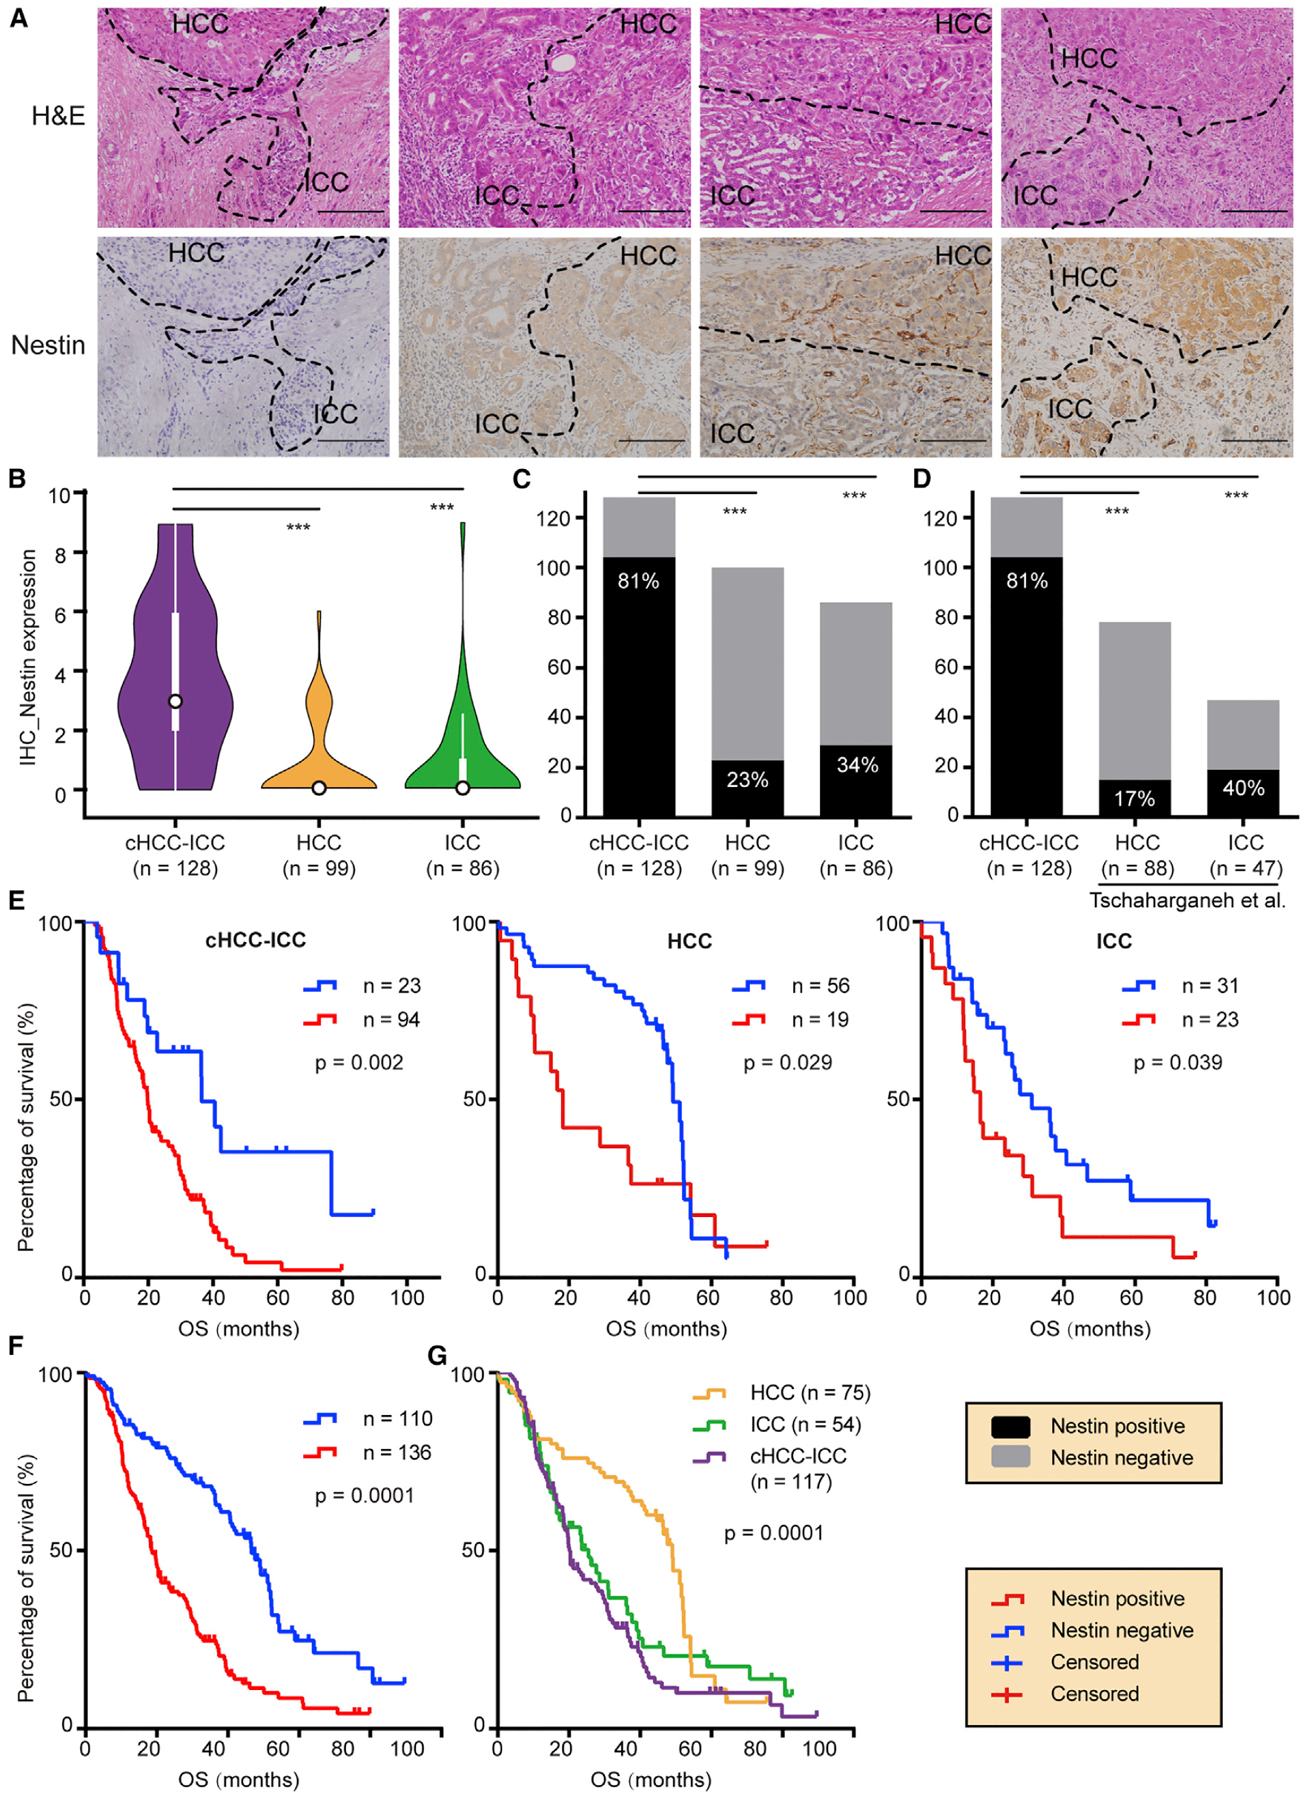
(A) Nestin IHC staining. Staining intensity was graded on a 0–3 scale. Representative combined type cHCC-ICC cases from grade 0 to grade 3 are shown. Scale bar, 200 μm.
(B) Violin plots of Nestin expression in cHCC-ICC, HCC, and ICC. ***p < 0.001, Student’s t test. In the violin plots, black outlined circles indicate the median; white boxes indicate the first and third quartiles; whiskers extend 1.5 times the interquartile range; widths of violin plots indicate kernel density of expression values, all data values are included.
(C and D) Nestin-positive rate in cHCC-ICC compared with HCC and ICC of our cohort (C) and the Tschaharganeh et al. cohort (D). The y axis shows the case number. ***p < 0.001, Fisher’s exact test.
(E) OS of cHCC-ICC, HCC, and ICC stratified into Nestin-positive and Nestin-negative groups, respectively.
(F) OS of all PLC cases stratified into Nestin-positive and Nestin-negative groups.
(G) OS of cHCC-ICC, HCC, and ICC.
In (E–G), p values were calculated with the log rank test.
See also Table S7.