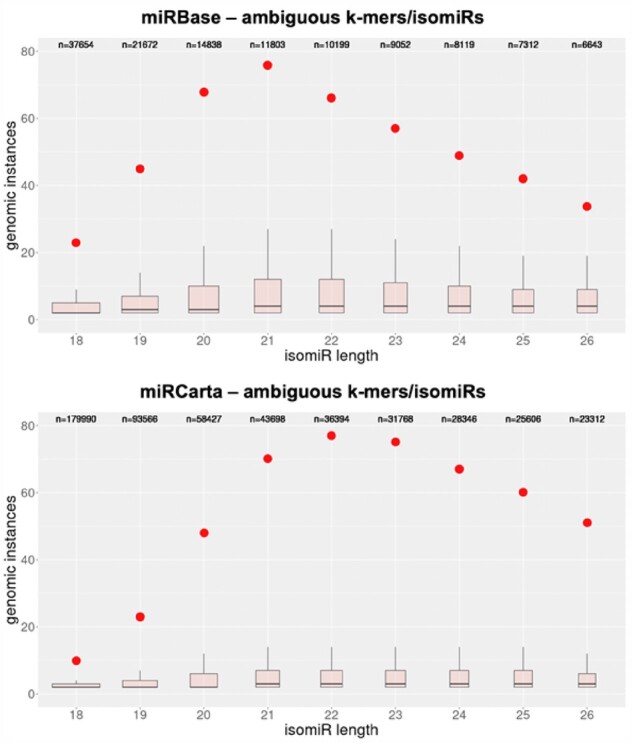
Fig. 3.

Boxplots showing the number of genomic instances for k-mers of different lengths. These k-mers represent all possible wild-type isomiRs that can be formed by the miRNA precursors contained in miRBase (top) and miRCarta (bottom), respectively, and have lengths between 18 and 26 nts. In each panel, the red dots represent the value at the 90th percentile of the corresponding boxplot. Note that the number of distinct k-mers (shown above each boxplot as “n=xxxxx”) differs considerably for different values of k
