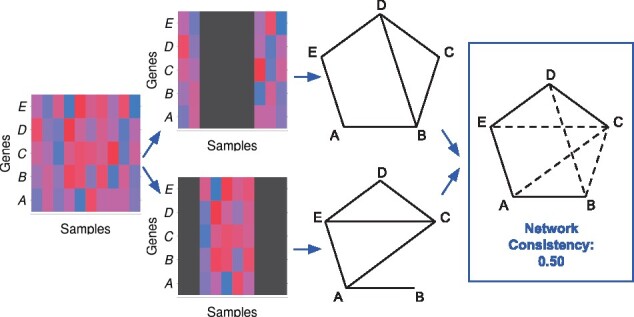
Fig. 1.

COGENT workflow schematic. In this example, the input data are a gene expression matrix with rows corresponding to genes—in this case —and columns corresponding to samples (far left). First, the expression matrix columns are randomly split into two possibly overlapping groups of equal size (left). Then, a network is constructed from each of the sample groups (right). Finally, the two resulting networks are compared and the consistency between them is calculated (far right). In this example, the two networks have six edges each, and overlap at four of these edges. One measure of their consistency is the Jaccard index between their edge sets (see Supplementary Section S4), which in this case is 0.50
