Figure 2.
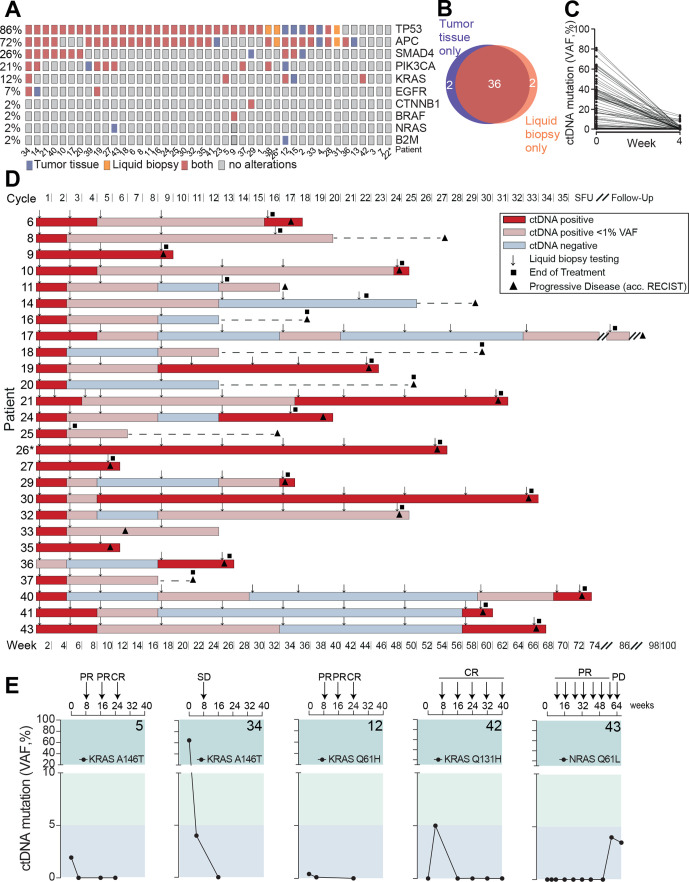
Mutational profiling and liquid biopsy disease monitoring. (A) Distribution of mutation spectra in FFPE tumor tissue and liquid biopsy at baseline evaluation. (B) Venn diagram of patients of which tumor driver mutations were detected by gene panel sequencing in FFPE tissue and/or liquid biopsy, respectively. (C) Circulating tumor (CT) DNA clearance from baseline to week 4 after treatment initiation. (D) Serial liquid biopsy testing in patients with disease progression during observational period. Gray box: increase or reappearance of ctDNA prior to clinical PD in weeks. Line indicates median. (E) KRAS and NRAS circulating tumor DNA monitoring during AVETUX therapy regimen. Respective patient number in bold. Patients with MSI are marked with asterisk. CR, complete response; FFPE, formalin-fixed paraffin-embedded; PR, partial response; PD, progressive disease; SD, stable disease; VAF, variant allele frequency; SFU, safety follow-up.

