
Figure 2.
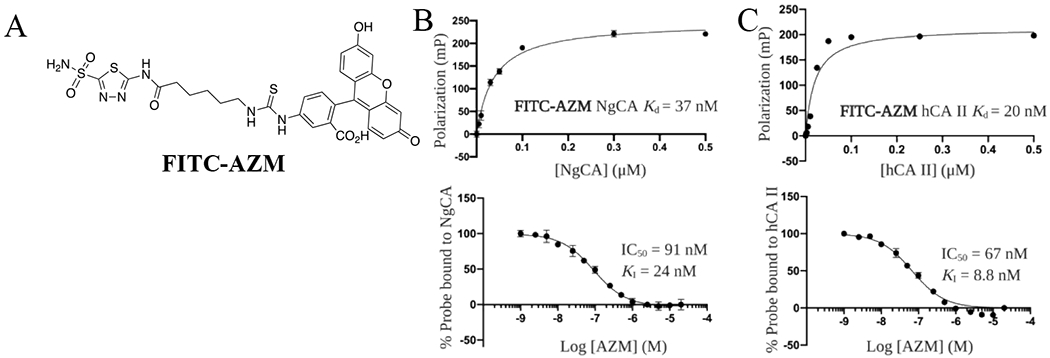
Fluorescent probe and FP assay development. (A) Structure of FITC-AZM fluorescent probe. (B) Titration curve of NgCA with 10 nM FITC-AZM (top), Competition assay for AZM to displace FITC-AZM probe from NgCA (bottom). (C) Titration curve of hCA II with 10 nM FITC-AZM (top), Competition assay for AZM to displace FITC-AZM probe from hCA II (bottom).