
Figure 7.
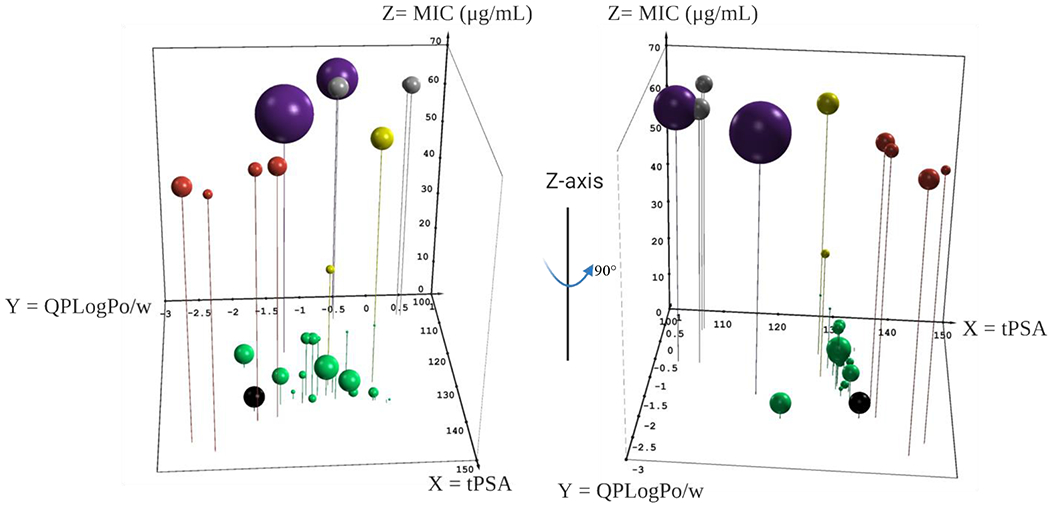
Three-dimensional scatterplot to assess the relationship between physicochemical properties and antimicrobial activity. QikProp metrics tPSA (Å, X-axis), QPLogPo/w (Y-axis) and MIC (μg/mL, Z-axis). Size of bubble corresponds to Ki (nM) versus NgCA as determined by CO2 hydration assay. Analogs with: < 64 μg/mL and < 100 nM Ki (green); contain quaternary carbon (yellow); polar pendant groups (red); no carbonyl (gray); and reduced NgCA activity (violet). AZM is shown in black. Plot was made in Excel using the 5dchart add-in (www.5dchart.com).