


Figure 5.
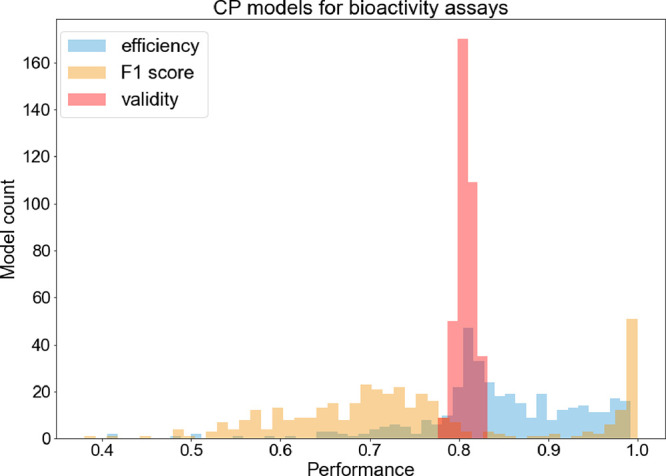
Histogram of the performance distribution of the CP models for the biological assays. All models were valid but their efficiencies and F1 scores showed a high degree of variability.
Official websites use .gov
A
.gov website belongs to an official
government organization in the United States.
Secure .gov websites use HTTPS
A lock (
) or https:// means you've safely
connected to the .gov website. Share sensitive
information only on official, secure websites.
Histogram of the performance distribution of the CP models for the biological assays. All models were valid but their efficiencies and F1 scores showed a high degree of variability.